Project Flow within a Sprint
This section visualizes the flow of work items (tickets) within a specific sprint cycle in the Sprint Reports for Jira app. Understanding this flow helps project managers and teams track progress, identify potential issues, and optimize their workflow. We show this flow based on both the number of tickets and by story points.
Stages of a Sprint
-
Previous Sprint: Represents tickets carried over from the previous sprint that are still in progress or unresolved.
-
Planned Tasks: Captures tickets that were added to the selected sprint before it began. These tasks were likely planned during the sprint planning session and represent the intended workload for the sprint.
-
Ad-hoc Tasks: Encompasses tickets added to the current sprint after it had started. These tasks may arise due to unforeseen requirements, changes in priorities, or bug discoveries.
- Ad-hoc Bugs: A subset of ad-hoc tasks specifically categorized as bugs or defects discovered during the sprint.
- Ad-hoc Enhancements: All ad-hoc tasks excluding ad-hoc bugs. These represent new feature requests, improvements, or other unplanned work added mid-sprint.
-
Completed Tasks: Represents tickets that were successfully completed and resolved within the designated sprint timeframe.
-
Spillover: Captures tickets that were not completed by the end of the sprint and are carried over to subsequent sprints for further work.
-
Dropped Tasks: Represents tickets that were removed from the sprint without being completed or carried over. These tasks may be deemed irrelevant, infeasible, or require further planning before re-inclusion in future sprints.
Interpreting the Project Flow Sankey Chart
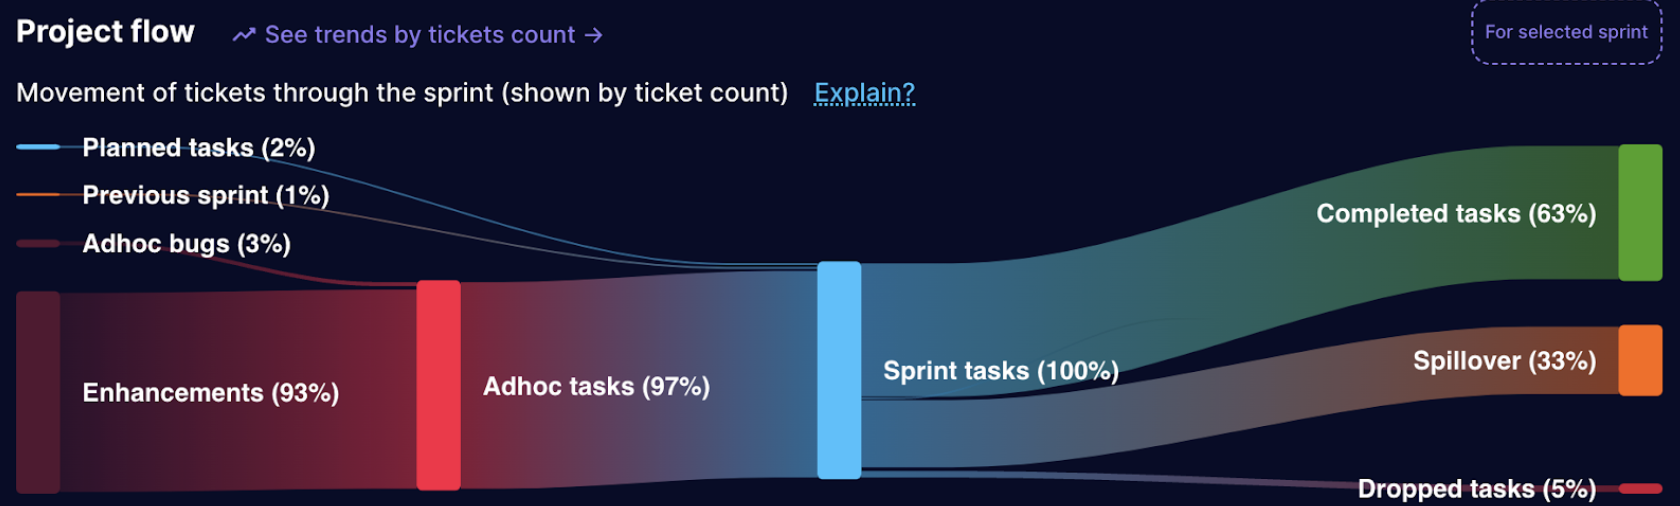
The Sprint Reports for Jira app utilizes a Sankey chart to visually represent the flow of work items (tickets) within a specific sprint. This chart helps project managers and teams gain valuable insights into the efficiency, bottlenecks, and overall health of their workflow.
Understanding the Sankey Chart
The chart resembles a directed acyclic graph with nodes and arrows.
- Nodes: Represent different stages in the project flow, such as "Previous Sprint," "Planned Tasks," "Completed Tasks," "Spillover," and "Dropped Tasks" (as described earlier).
- Arms: Indicate the movement of tickets between different stages. The width of the arrow is proportional to the number of tickets that transitioned between those specific stages.
Interpreting the Flow
- Start at the "Previous Sprint" node: This section shows the number of tickets carried over from the previous sprint.
- Follow the arms: Trace the movement of tickets through different stages.
- Wider arms represent a larger volume of tickets moving between stages.
- Identify stages with a significant influx or outflow of tickets.
- Analyze each stage:
- "Planned Tasks": This section should ideally show a smooth flow into "Completed Tasks" with minimal movement to other stages. A high volume of planned tasks moving to "Dropped" or "Spillover" might indicate over-ambitious planning or unforeseen challenges.
- "Ad-hoc Tasks": A moderate amount of ad-hoc tasks is expected, but a significant influx can disrupt the flow and impact predictability.
- "Completed Tasks": This section ideally shows the largest volume of tickets, indicating efficient completion within the sprint.
- "Spillover" and "Dropped Tasks": While some spillover is inevitable, excessively high volumes can indicate underestimation of effort, scope creep, or inefficiencies. Analyze dropped tasks to understand if they were truly irrelevant or if improvements can be made to prevent future drops.
Analysis of Spillover
It is notable to see that spillover is often high in conjunction with a high volume of Ad-hoc tasks. This suggests that a significant number of unplanned tasks are being introduced during the sprint, which can disrupt the flow of work and contribute to spillover into subsequent sprints. It is crucial to:
- Analyze the reasons behind the high volume of Ad-hoc tasks. Are they due to unclear requirements, frequent changes, or inadequate planning?
- Implement strategies to mitigate Ad-hoc tasks. This might involve improving requirement gathering, enforcing change management processes, or setting realistic sprint goals.
- Monitor the impact of implemented changes over time by analyzing trends in the Sankey chart and other relevant metrics.
By effectively interpreting the project flow Sankey chart and analyzing the underlying data, project managers and teams can:
- Gain insights into workflow efficiency and identify bottlenecks.
- Make data-driven decisions about resource allocation, sprint planning, and Ad-hoc task management.
- Continuously improve their workflow for better predictability and project delivery.
By effectively interpreting the project flow Sankey chart and analyzing the underlying data, project managers and teams can: Gain insights into workflow efficiency and identify bottlenecks. Make data-driven decisions about resource allocation, sprint planning, and Ad-hoc task management. Continuously improve their workflow for better predictability and project delivery.