Metrics Explained
- Project Flow: Tracks planned vs. unplanned work, how much work is carried over, and overall sprint adherence.
- Code Delivery: Measures how fast code moves—from commit to merge to deploy—and highlights areas needing process improvements.
- Quality Signals: Alerts you to potential quality risks via bug rates, review practices, and developer output.
- DORA Metrics: Industry-standard KPIs (lead time, deployment frequency, change failure rate, MTTR) that gauge your team's overall DevOps efficiency.
This document provides a detailed explanation, with examples, for each metric reported by MiddlewareHQ. Use this guide as a reference to understand how each measurement can provide insights into team performance and help optimize your processes.
Table of Contents
Project Flow
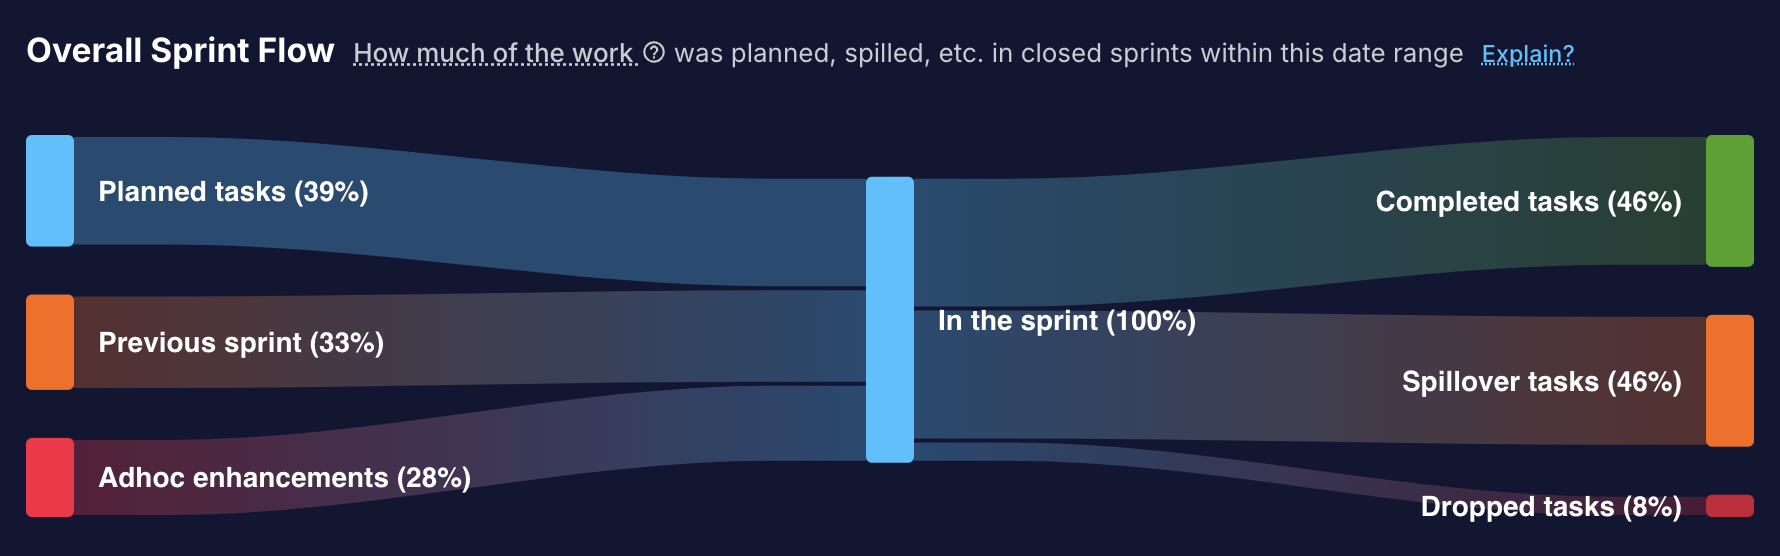
All Project Flow metrics are based on the number of tickets in a sprint.
Not story points or any other estimation based measurements. That is coming soon.
Planned Tickets %
Definition:
Planned Tickets % measures the fraction of tickets that were added to the sprint before it started. This indicates disciplined planning and helps identify planned work versus unexpected additions. It excludes tickets carried over or added adhoc after the sprint kickoff.
If a sprint has 50 tickets and 40 of those were planned in advance (with the remaining 10 being either carried over or added adhoc mid-sprint), then Planned Tickets % = (40/50) × 100 ≈ 80%.
It's possible on Jira or YouTrack to specify the sprint start date manually. If the new sprint's start is set earlier than the previous sprint's end, tickets from the older sprint may be added after the sprint begins, thus appearing as adhoc.
Previous Tickets %
Definition:
This metric indicates the proportion of tickets that were not completed during their originally planned sprint and have been carried over into a subsequent sprint. It sheds light on backlog accumulation and potential challenges with planning or execution.
If a sprint has 50 tickets and 10 tickets from a previous sprint continue into the current sprint, then Previous Tickets % = (10/50) × 100 = 20%.
A ticket qualifies as a previous ticket only if it originates in an earlier sprint. However, if a ticket is added to the current sprint after it has started (for instance, due to overlapping sprint boundaries), it will appear as adhoc.
Middleware allows you to configure in-progress, or done states independently from Jira/YouTrack. This means it's possible to have tickets defined as "completed" on Middleware, which aren't considered resolved on Jira.
Unresolved issues/tickets on Jira will continue moving to subsequent sprints on Jira, but will be skipped on Middleware. This will cause data on Middleware to look different from your existing dashboards on Jira.
Adhoc Tickets %
Definition:
Adhoc Tickets % quantifies tasks that were not initially planned in the sprint backlog. These tasks—such as urgent bug fixes, unexpected support requests, or sudden requirement changes—reflect deviations from the original plan and can affect sprint predictability.
Functionally, any tickets added to a sprint after the sprint's start date is considered ad-hoc.
During a sprint with 60 tickets, if 5 tickets are added after the sprint begins because of emerging issues, then Adhoc Tickets % = (5/60) × 100 = 8%.
Some times there might be work added to a sprint that was always intended to be added to the sprint, but it just happened to be added later. Perhaps because the same capacity was blocked using a placeholder issue, or maybe there was a common understanding that more tickets will be created as the sprint progresses. By default, these issues will be counted as ad-hoc.
You can set specific labels on your issues, which can later be configured on Middleware which allows these issues to be included as planned or carried over instead.
Adhoc Enhancements %
Definition:
This metric measures unscheduled improvements or feature upgrades implemented during the sprint. It highlights instances where creative or functional enhancements are introduced outside of the planned scope.
Adhoc enhancements are a part of Adhoc tickets.
If there's 50 tasks in the sprint, of which 40 are planned, and 10 are adhoc with a breakdown of 6 bugs and 4 enhancements, then the adhoc enhancement percentage is 4/50 = 8%. This percentage is ultimately presented related to the whole number of tickets in the sprints.
Adhoc enhancements are often going to be improvements or upgrades which are naturally less critical to deal with compared to bugs. It's a good idea to move some of the other planned/carried over tasks to subsequent sprints or drop them if appropriate. This will keep your sprint capacity within limits, and increase the likelyhood of a well-run sprint.
Tickets moved to a later sprint before the sprint has closed will not count as spilled.
Doing so will also improve your Sprint Adherence %.
Adhoc Bugs %
Definition:
Adhoc Bugs % tracks the proportion of unplanned bug fixes carried out during the sprint. It provides insight into quality issues that emerge unexpectedly and require immediate attention.
Adhoc bugs are a part of Adhoc tickets.
If there's 50 tasks in the sprint, of which 40 are planned, and 10 are adhoc with a breakdown of 6 bugs and 4 enhancements, then the adhoc bugs percentage is 6/50 = 12%. This percentage is ultimately presented related to the whole number of tickets in the sprints.
Completed Tickets %
Definition:
This metric represents the percentage of all tickets that were completed by the end of the sprint. It is an indicator of overall sprint productivity and task closure.
Specifically, the issues which are marked as completed within the sprint, and are present in the sprint at the time of sprint closure (as opposed to being moved out of the sprint for any reason) are counted as completed tickets.
If a sprint has 60 tickets and 55 are completed by the end, then Completed Tickets % = (45/50) ≈ 90%.
Dropped Tickets %
Definition:
Dropped Tickets % tracks the tickets that were originally planned for the sprint but were not completed within the sprint, and not taken up again in a subsequent sprint. This helps gauge changes in priorities or scope adjustments during the sprint.
If 5 out of 50 planned tickets are dropped, then Dropped Tickets % = (5/50) × 100 = 10%.
When a ticket is not completed within a sprint and is completed after the sprint, that ticket is naturally not moved into a subsequent sprint. But because the ticket was not completed within the previous sprint, as far as that sprint is concerned - it's a dropped ticket.
Spillover Tickets %
Definition:
Spillover Tickets % denotes the fraction of tickets that were not completed in the current sprint and are carried over to the next. It highlights potential issues in workload estimation or execution delays.
If 8 out of 50 planned tickets are left unfinished and carried over, then Spillover Tickets % = (8/50) × 100 = 16%.
If you're seeing consistently high spillover, it's a good idea to focus on common factors in the spilled issues - such as who those issues are assigned to, and reduce the assigned work by that much in subsequent sprints to see if that brings things in control.
You may also analyze the specific dev's insights on Middleware.
Doing so will also improve your Sprint Adherence %.
Sprint Adherence %
Definition:
Sprint Adherence % reflects how closely the team's completed work aligns with what was originally planned. High adherence suggests stable planning and execution, whereas low adherence may indicate frequent scope changes.
The specific formula is completed / completed + spillover.
It excludes dropped issues, and any input metrics (planned, previous, adhoc). It basically says, of everything that was aimed to be completed in a sprint, how much was actually completed.
This allows you to take on adhoc work, and balance it out by dropping some work.
If a sprint has 50 tickets, and 40 are completed while 10 spillover, then Sprint Adherence % = 40 / (40 + 10) = 80%.
If a sprint has 50 tickets, 40 are completed, 5 spillover, and 5 are dropped, then Sprint Adherence % = 40 / (40 + 5) ≈ 89%.
High Sprint Adherence demonstrates effective planning and predictable execution. Low adherence might indicate frequent scope changes or misalignment on priorities.
Code Delivery
Cycle Time
Definition:
Cycle Time measures the total duration from the creation of a pull request (PR) until it is merged. It provides insight into the efficiency of the code review and merge processes.
This is explained in much more detail and examples here: Cycle Time & Lead Time
If a PR is created on Monday and merged on Friday, the Cycle Time is 5 days.
Long cycle times may indicate process inefficiencies or bottlenecks during review and testing.
You can identify bottlenecks in your team on Middleware here: https://app.middlewarehq.com/collaborate/team
At times there may be PRs which have exceedingly high Cycle Times purely because they weren't a priority for a while and were picked up much later, perhaps by someone else. This will be uncommon, but just 1-2 such PRs can push up your team's average up significantly, which wouldn't be an accurate representation of what your team actually is like day-to-day.
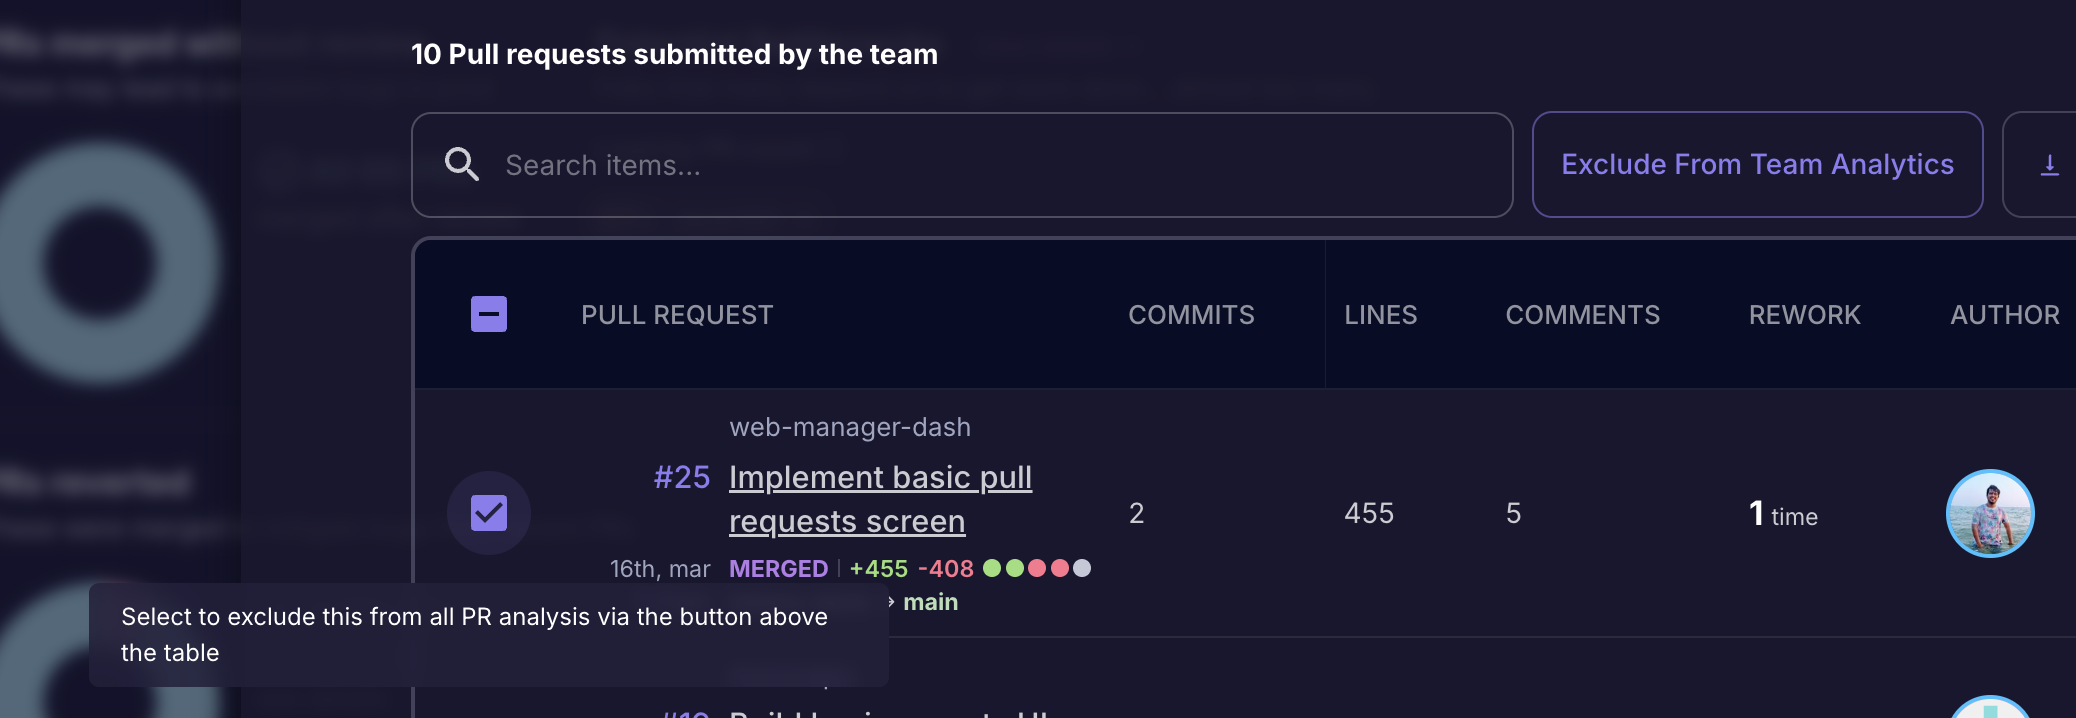
You can exclude such PRs from Team Analytics of those specific teams.
- Find the "See stats for merged PRs" button in Delivery Overview.

- In the overlay that opens, find the PRs Table on the lower part of the UI.
- Click the checkbox beside the PRs you want to exclude, and click on the "Exclude from Team Analytics" button above the table.
First Response Time
Definition:
This metric quantifies the time elapsed between a PR's creation and its first review comment or feedback. It is a key indicator of how responsive the team is to incoming changes.
First Response Time is a form of wait time, where it's representative of how long someone waited before their PR was acted upon, either to review.
If a PR is opened on Tuesday and receives its first review comment on Wednesday, the First Response Time is 1 day.
Because it's not possible to accurately know exactly when someone started doing a review - it's best to not aim for FRT to be zero (0), and expect to have a correlation between PR sizes and first response time.
If the FRT of a PR is very close to zero, it may be an indication that code reviews aren't happening sufficiently thoroughly.
First Commit To Open
Definition:
The First Commit To Open metric tracks the duration from the very first commit for a feature until a PR is opened. This shows how quickly development efforts transition into formal review.
If work on a feature starts on Monday with the initial commit and a PR is opened on Wednesday, then First Commit To Open is 2 days.
Rework Time
Definition:
Rework Time tracks the time spent revising code after receiving review feedback, before the final approval and merge. It provides insight into the need for improvements or corrections.
Rework time starts when any a non-approval comment or request for changes is left on the PR.
If a PR receives review feedback on Wednesday and the revisions are completed by Friday, Rework Time is 2 days.
Reducing Rework Time can often be achieved by improving initial code quality and incorporating more effective automated testing. Getting early-feedback on some code that is not-yet ready for a proper review can also reduce rework time, especially for larger PRs or new employees.
Merge Time
Definition:
Merge Time indicates the duration from when a PR receives approval until it is merged. It highlights the final steps and any delays in integrating changes. This may also happen if the merge will result in a CI pipeline being triggered, and the team only deploys at a fixed time.
This is a form of wait time. Ideally you would want this time to be as low as possible.
If a PR is approved on Wednesday and merged on Friday, the Merge Time is 2 days.
Merge To Deploy
Definition:
This metric measures the time taken from merging a PR until its code is deployed to production. It reflects the speed and efficiency of the deployment pipeline.
If you have workflows configured for your repos (instead of the default of counting merges as deployments), you can also see insights of how long your deployments take to run and how many PRs went in each deployment.
If a PR is merged at 10:00 AM and the code is deployed by 4:00 PM on the same day, then Merge To Deploy is 6 hours.
Quality Signals
Bugs %
Definition:
Bugs % indicates the proportion of tickets identified as bugs relative to the total number of tickets. It serves as a measure of the overall software quality and stability during a sprint.
This metric is calculated based on sprints the % of tickets by count, in your sprints.
If there are 100 tickets in a sprint and 15 of those are bugs, then Bugs % = (15/100) × 100 = 15%.
Planned Ticket Success Rate
Definition:
This metric measures the percentage of planned tickets that are successfully completed within the sprint. It reflects the effectiveness of sprint planning and execution.
If there are 50 tickets in a sprint, of which 30 are planned - and out of those 30 tickets, 15 were completed (how many out of the other 20 were completed is irrelevant here), then your Planned Ticket Success Rate = (15/30) × 100 = 50%.
PRs Merged Without Review
Definition:
PRs Merged Without Review tracks the proportion of pull requests that were merged without undergoing peer review. A high percentage may indicate potential quality risks or process shortcuts.
In delivery overview, you can see the specific PRs that were merged without a review for a single team.
If 10 out of 100 merged PRs did not go through a review process, then PRs Merged Without Review = (10/100) × 100 = 10%.
A high percentage of PRs merged without review can signal process weaknesses and potential quality risks. Correlate this with Bugs % and Change Failure Rate.
Flashy PRs
Definition:
Flashy PRs refer to those that were merged too quickly, typically under 1 hour (though the threshold is configurable and can be as low as 15 minutes per team). These PRs may not have received adequate review.
A PR that was opened, approved, and merged within 30 minutes might be flagged as a Flashy PR, indicating a need to investigate whether the review process was thorough enough.
PR Count per Dev
Definition:
This metric calculates the average number of pull requests merged per developer within a given period. It can reflect team productivity and collaboration.
If 10 developers have collectively submitted 100 PRs in a sprint, then the PR Count per Dev is 100 / 10 = 10.
Middleware advises not measuring PR counts of individual developers in the pursuit of your efficiency and productivity goals. Measuring this metric at a team level (instead of dev level) serves to give you an idea about the PR throughput of your team, which can be correlated with the context you hold to understand whether this is acceptable or not. For some teams, 40 PRs per week may be low, while for others 10 per week may be great - depending on size, codebases, and bandwidth.
DORA Metrics
Lead Time
Definition:
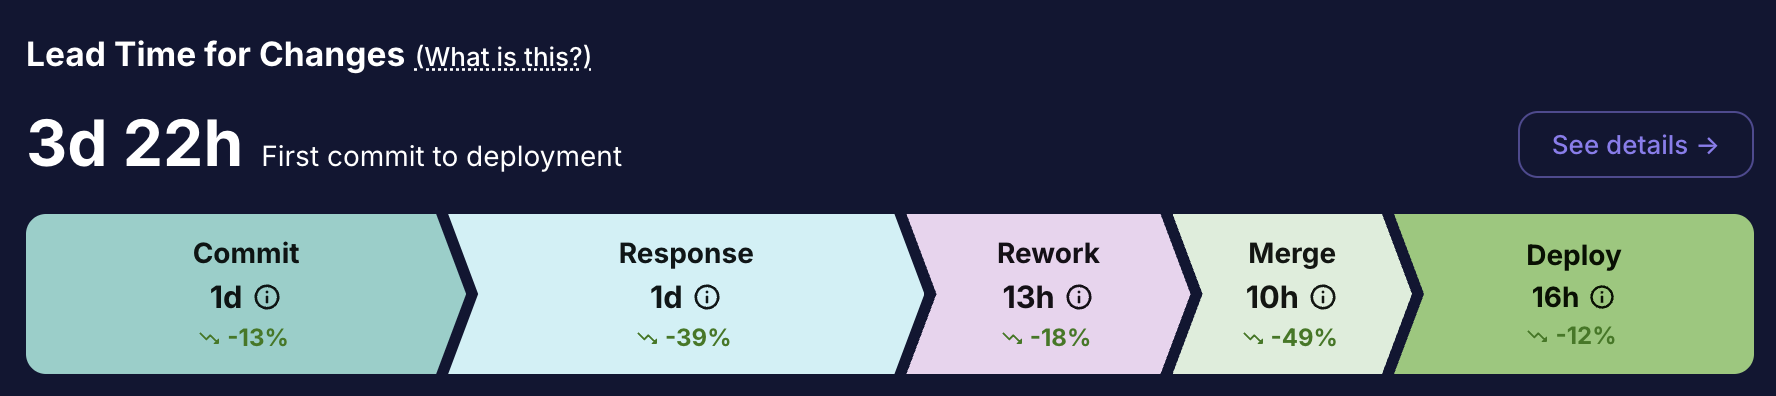
Lead Time measures the overall duration from a developer's first commit for a feature until the corresponding change is deployed to production. It includes all phases: from PR opening through review, merge, and deployment.
This is explained in much more detail and examples here: Cycle Time & Lead Time
If the first commit occurs on Monday and the change is deployed the next Monday, the overall Lead Time is 7 days.
Anomalous PRs with exceedingly high Lead Times which may not be representative of your usual delivery process would push up your Lead Time and Cycle Time averages significantly.
Middleware supports configuration to exclude such PRs from your analytics.
Read about it in "Custom Configuration" under Cycle Time
Change Failure Rate
Definition:
Change Failure Rate quantifies the percentage of deployments that result in failures or require rollbacks. It serves as an indicator of deployment stability and process quality.
If there are 100 deployments in a month and 3 result in failures, then Change Failure Rate = (3/100) × 100 = 3%. It doesn't matter if there were 50 failures, as long as those failures can be associated with 3 of the deployments.
This metric requires either Reverted PRs to be present, or an Incident management integration to be linked, such as Pagerduty, OpsGenie, and Zenduty.
Mean Time To Restore (MTTR)
Definition:
MTTR measures the average time taken to recover from a production failure or incident. It is a crucial metric for assessing the resilience and responsiveness of the team.
If an incident is identified at 2 PM and resolved by 5 PM, then MTTR is 3 hours.
This metric requires either Reverted PRs to be present, or an Incident management integration to be linked, such as Pagerduty, OpsGenie, and Zenduty.
Deployment Frequency
Definition:
Deployment Frequency represents how often new code is deployed to production, whether on a daily, weekly, or monthly basis. Higher frequencies generally indicate an agile and efficient development process.
If a team deploys code 20 times in a month, then the monthly Deployment Frequency is 5 per week. If a team deploys 100 times over two months, deployment frequency is 50 per month. The denominator shown on the UI depends on your selected cadence (in Reports & Trends) or the overall date range (in DORA Metrics & Cockpit)
Interchangeably used terms
| Topic | Terms |
|---|---|
| Jira/YouTrack issues | Issues, Tickets, Tasks, Work |
| Adhoc Work | Adhoc, Unplanned, Unexpected |
| Enhancements | Improvements, Feature Upgrades |
| Bugs | Defects, Errors |
| Pull Request | PR, Merge Request |
| Carryover | Issues from Previous Sprint, Carried Over |
| Spillover | Spilled Issues, Issues moved to the next sprint |
Summary & Next Steps
MiddlewareHQ's metrics are designed to provide complete visibility into your engineering workflow. By tracking:
- Project Flow metrics, you can determine how well you plan and manage work in your sprints.
- Code Delivery metrics help identify delays and optimize your development pipeline.
- Quality Signals ensure that the code quality is maintained and process risks are mitigated.
- DORA Metrics offer industry-standard measures to benchmark your team's overall performance.
Evaluate your current metrics data using MiddlewareHQ's dashboards. Identify the areas with the highest cycle or rework times, and use this guide to implement targeted improvements. Regularly review and adjust your workflows to maintain a balance between speed and quality.
For more detailed insights on each metric and additional resources, please refer to our MiddlewareHQ Documentation.
Happy optimizing and developing!