Introducing Roadmap
We know planning and executing can be overwhelming. Our new feature helps you quickly find what matters the most, saving time and reducing your manual effort.
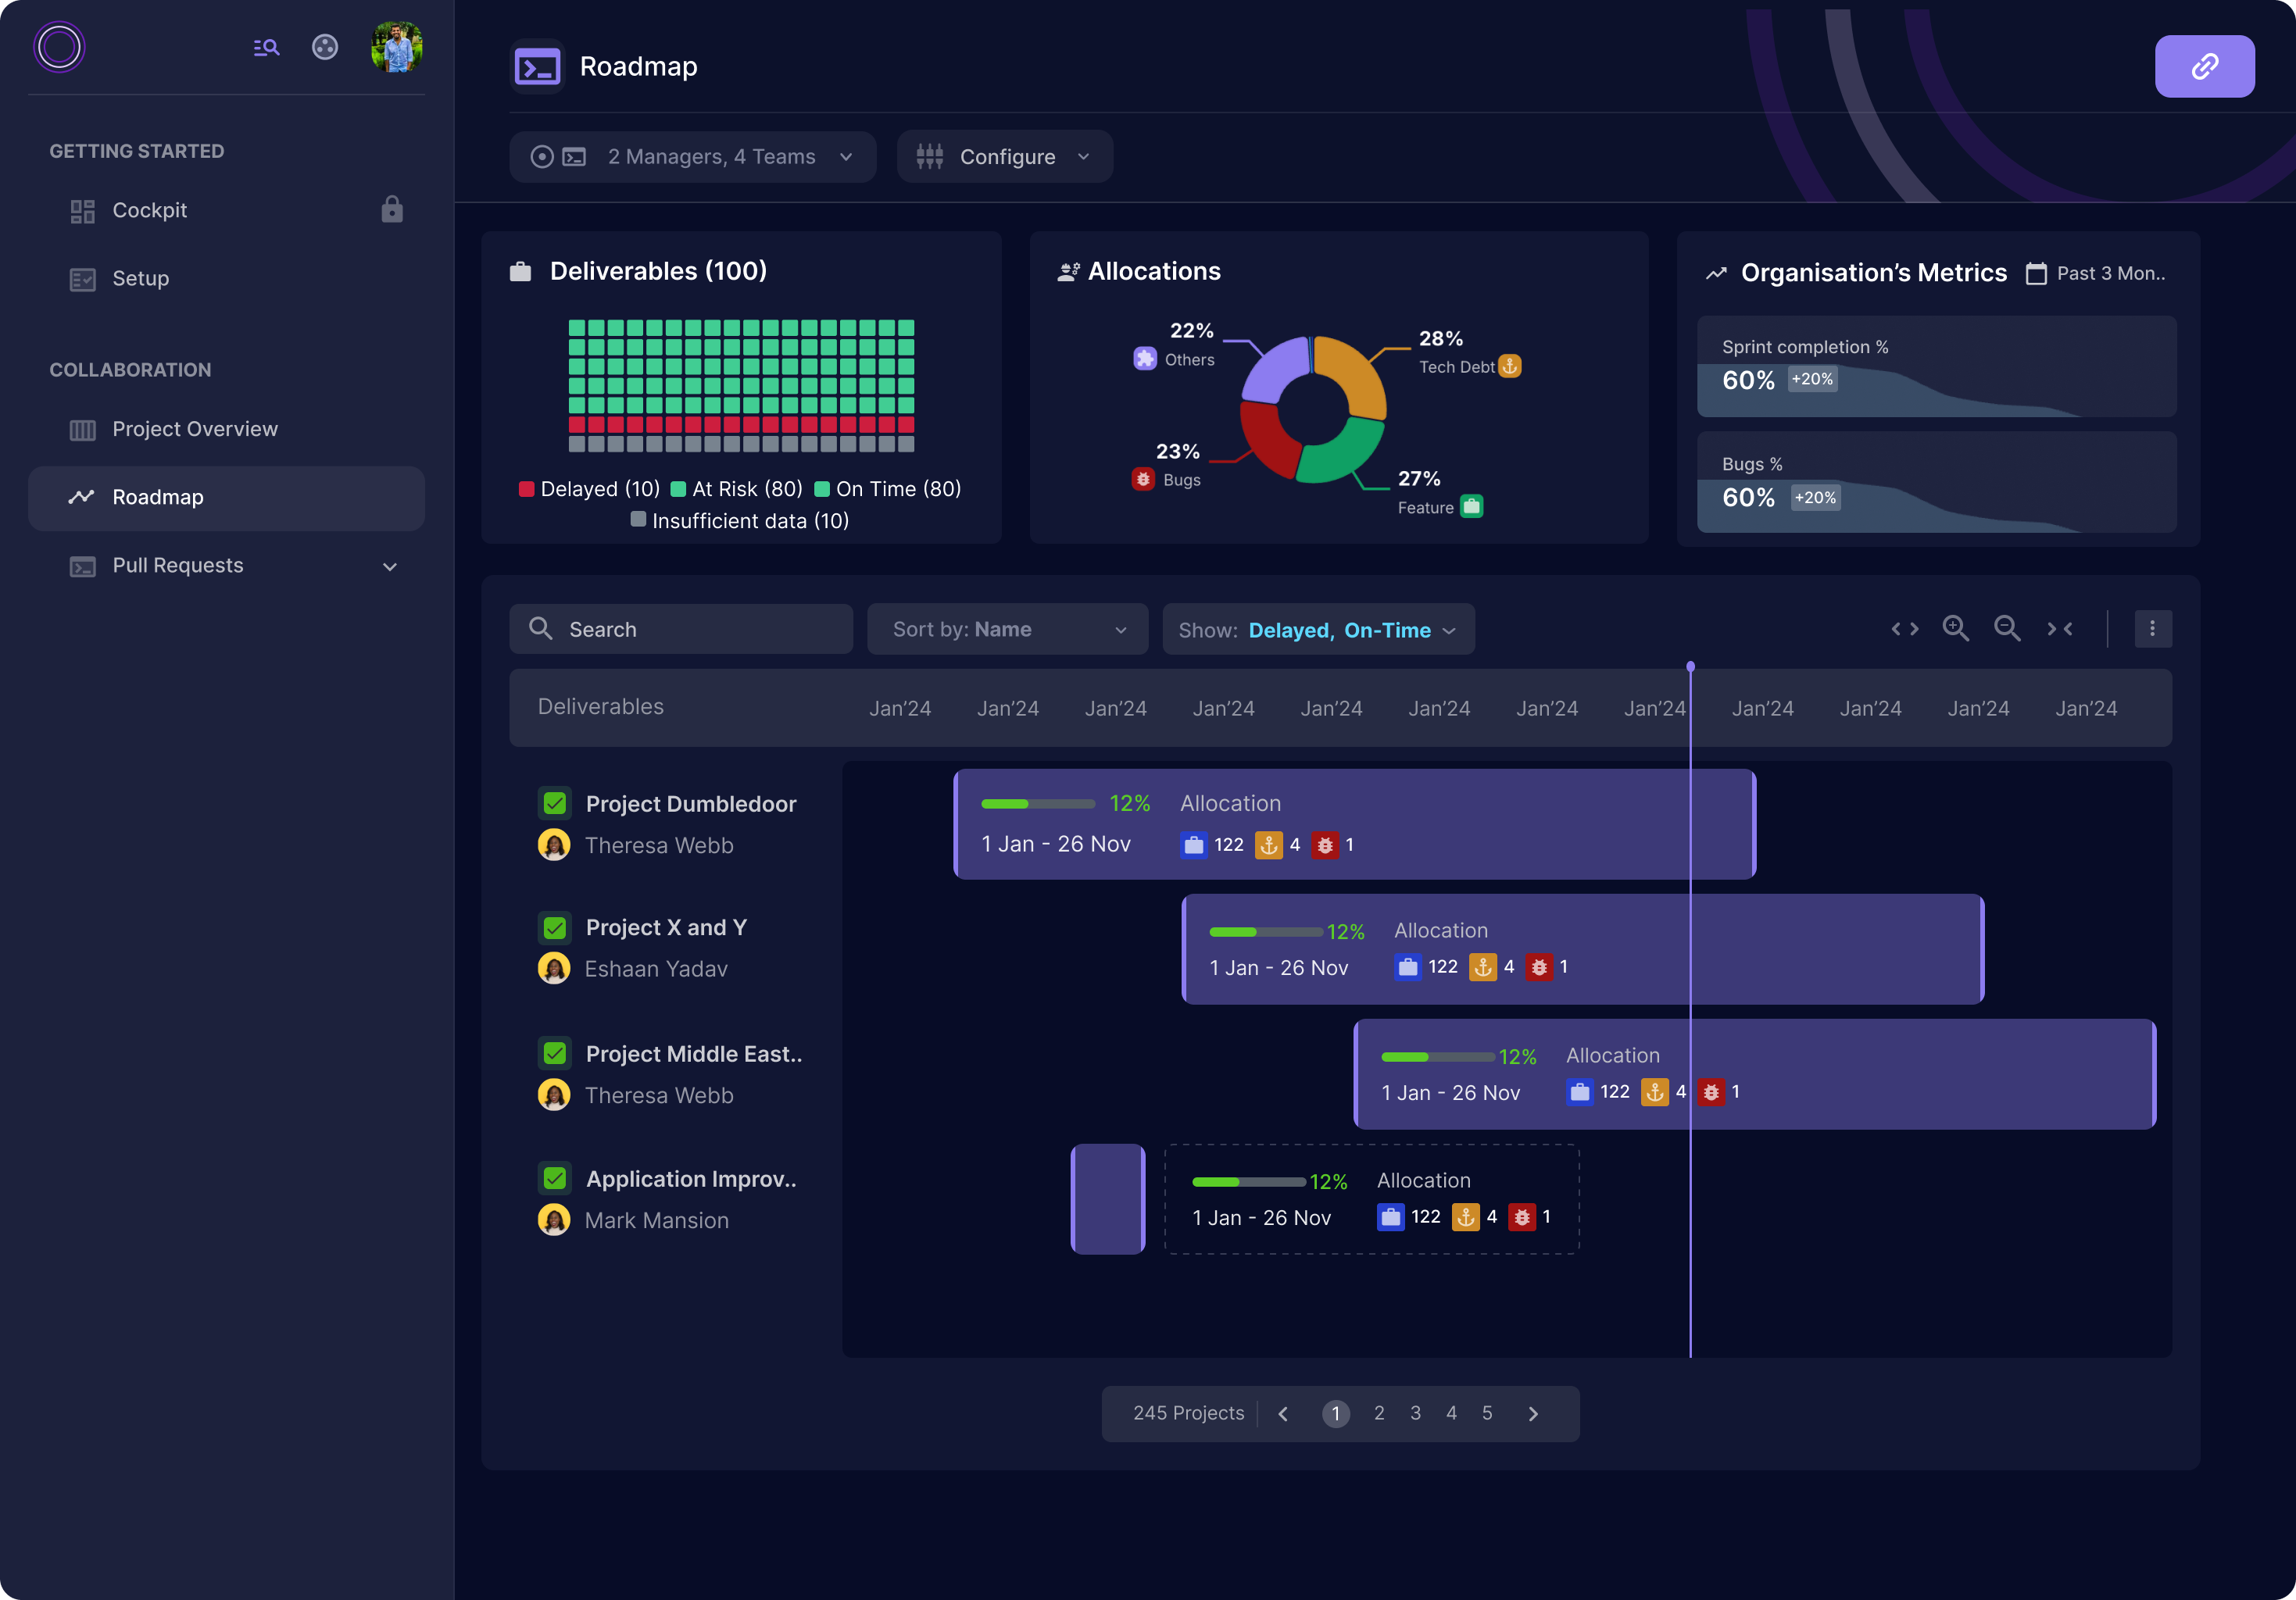
Who is it for? 👤
This feature is designed for leaders and managers who plan and oversee project execution and are responsible for shipping projects within a fixed timeline.
It’s challenging for leaders to manually track progress, identify bottlenecks, and anticipate potential delays in a project. With our roadmap feature, all of this becomes effortless!
What is it? 🤔
Roadmap enables you to see your deliverables (epics) within a selected timeline, along with their progress, projections, and other details to help you track your work effectively.
It provides both an overview and a detailed analysis of all your deliverables.
Key Benefits 🎁
- Track work distributed across teams.
- Spot risks and bottlenecks early.
- Get a bird's-eye view of your entire project flow and ticket distribution.
- Understand where your developer resources are focused; from research to maintenance.
How does it work? 💻
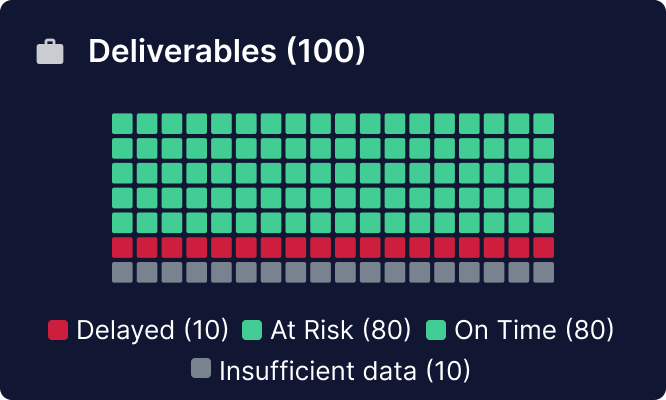
Deliverables 🎯
This shows the total number of deliverables (epics) on your JIRA board. We determine if you are on time, at risk of delay, or delayed so you don't have to. :)
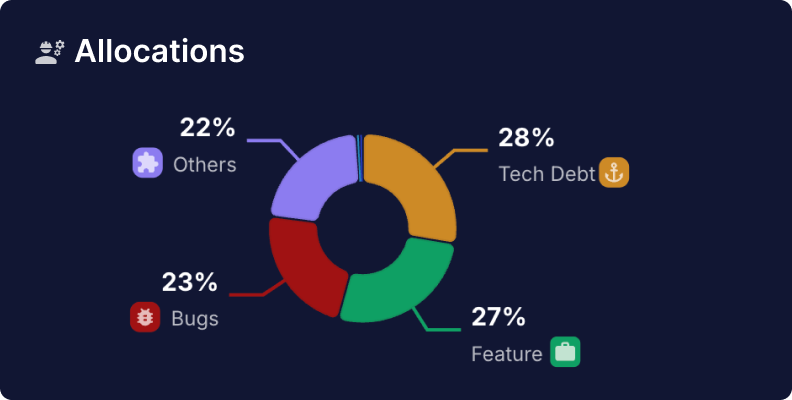
Allocations 📊
This section shows the nature of work allocated to help you understand how much bandwidth is taken by each type of work. These categories can be defined in settings.
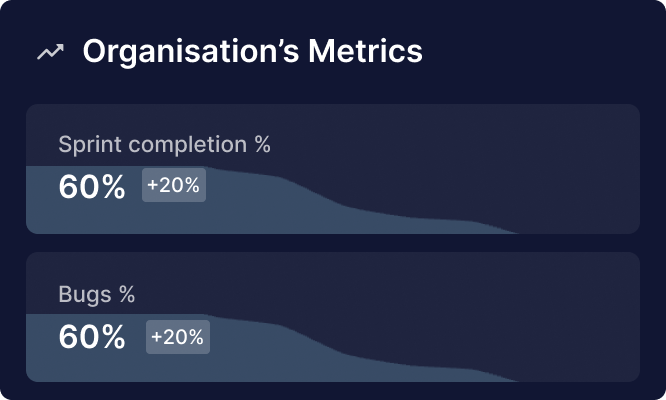
Organization Metrics 📈
This section provides insights into the work velocity of the entire organization, helping you understand performance trends over time.
Timeline & Projects 📅
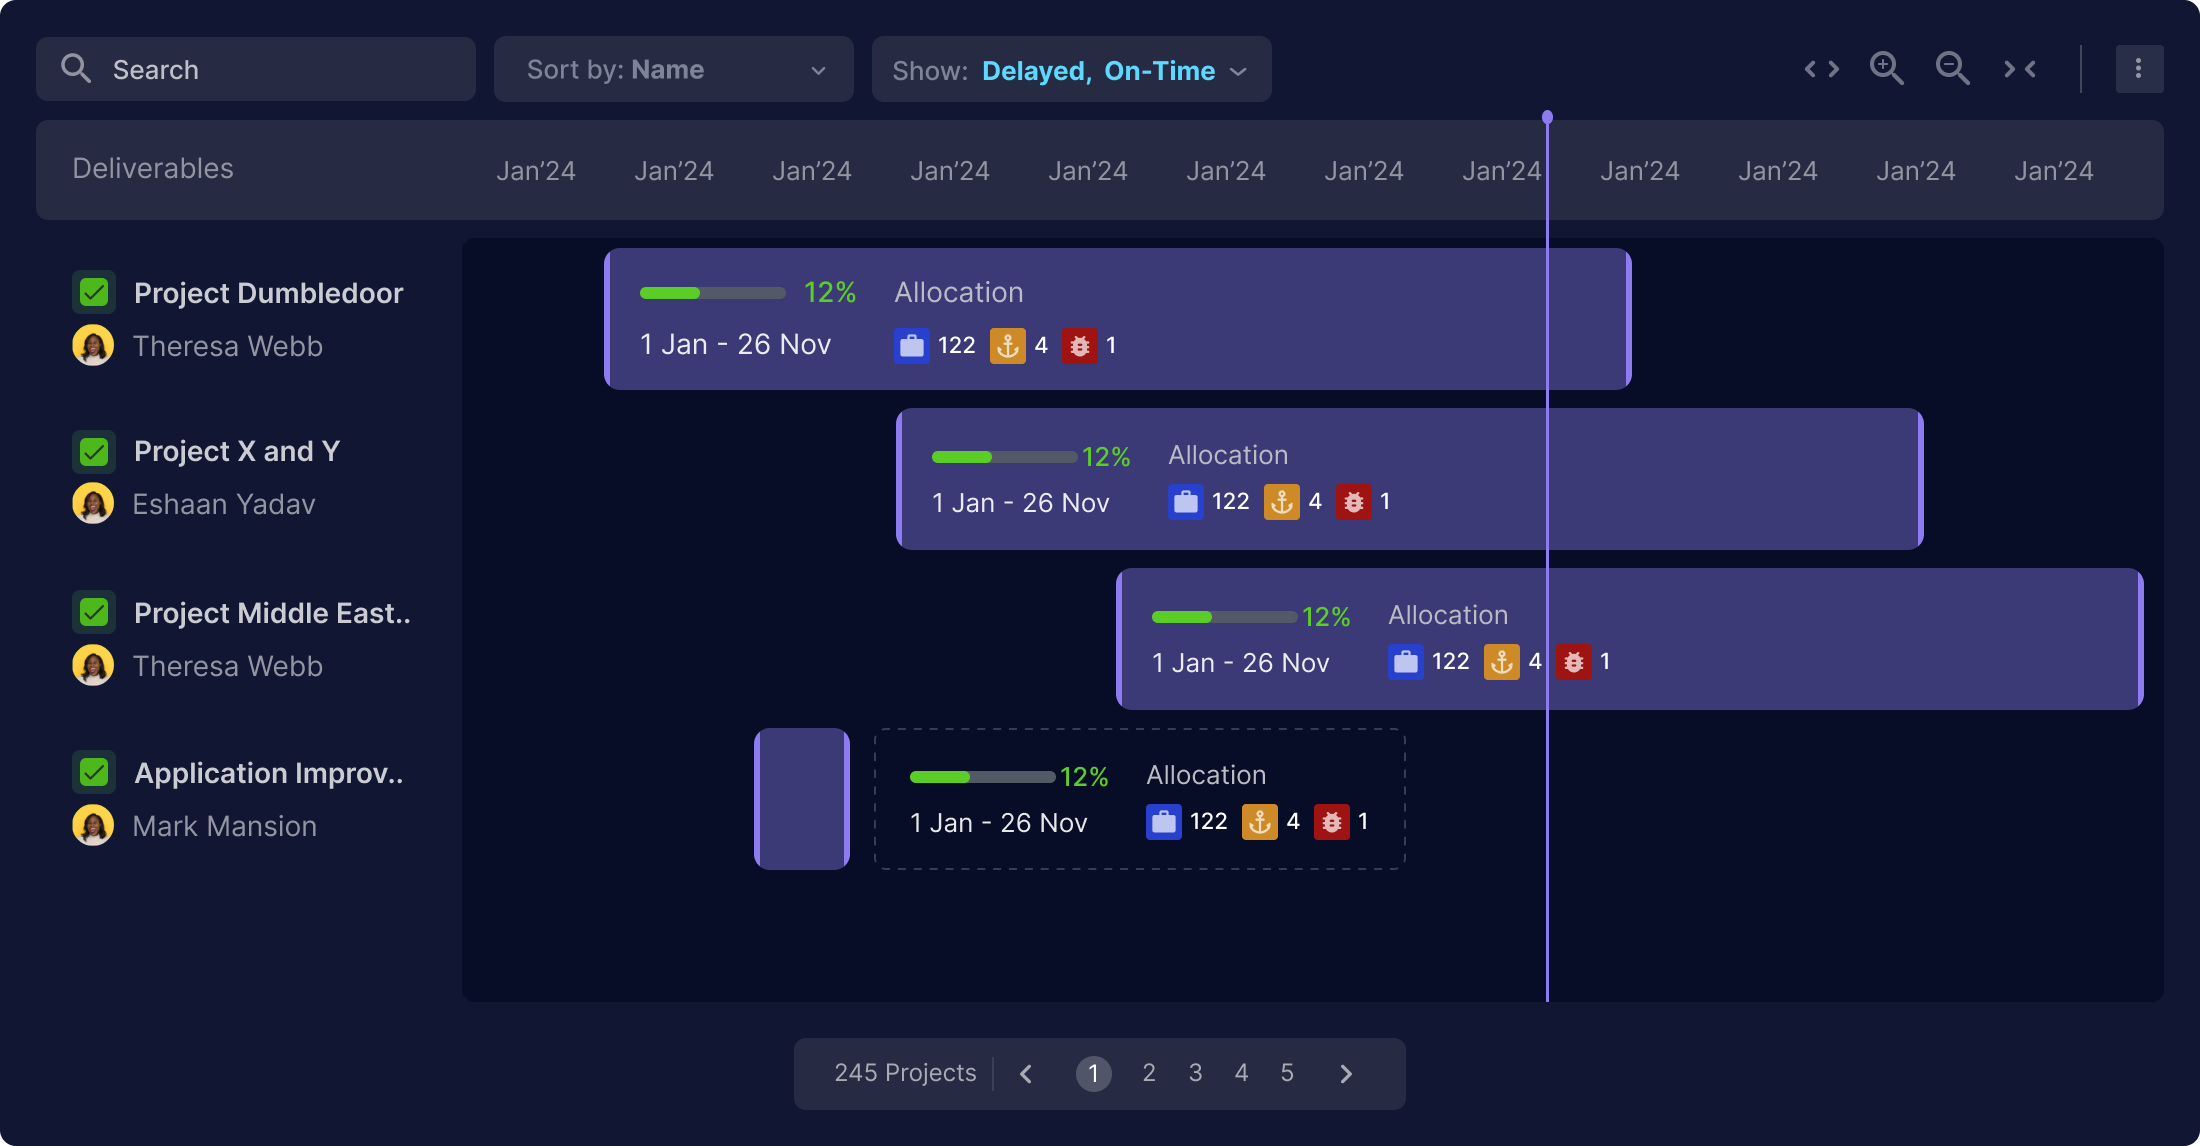
Here, you can view all deliverables, along with their status, POC (Point of Contact), projections, start and end dates, and progress.
Each project is represented by a blob on the right section of the timeline. You can sort, filter and search the deliverables as you prefer.
Deliverable Details 🔎
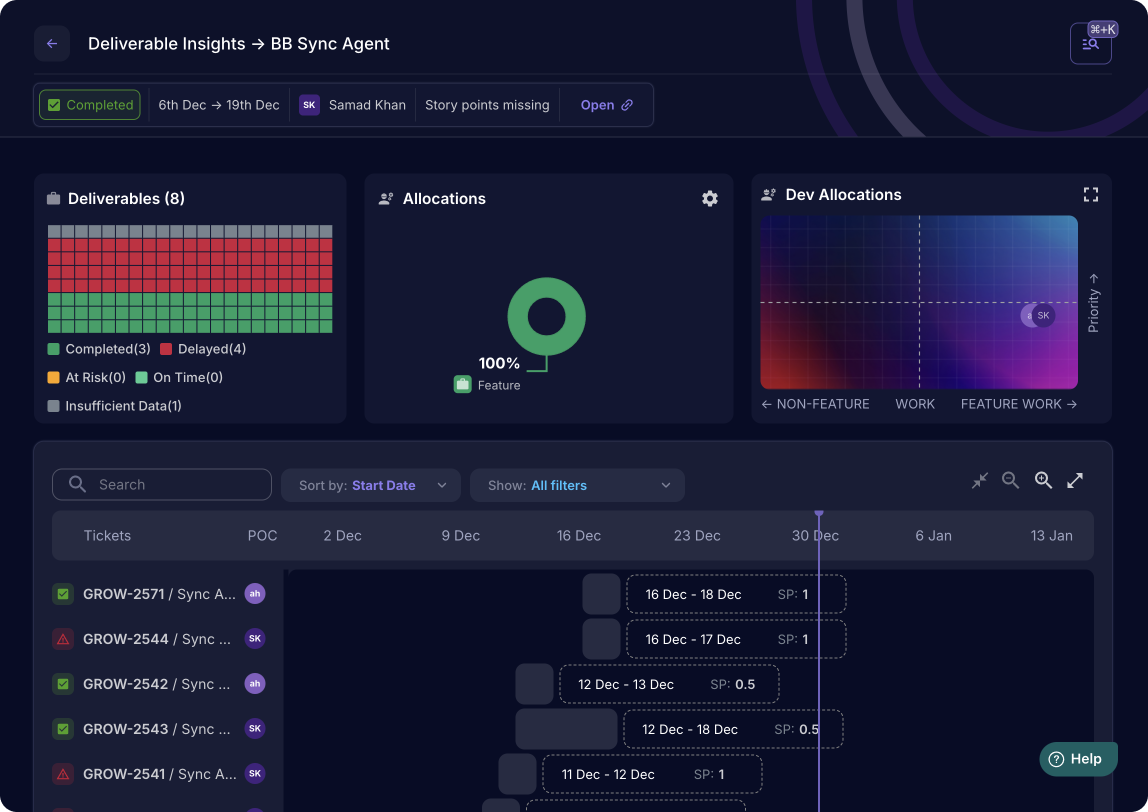
Click on any deliverable to dive deep into its tickets and allocations.
Top Bar
It contains the status, projections, POC, story points, etc.

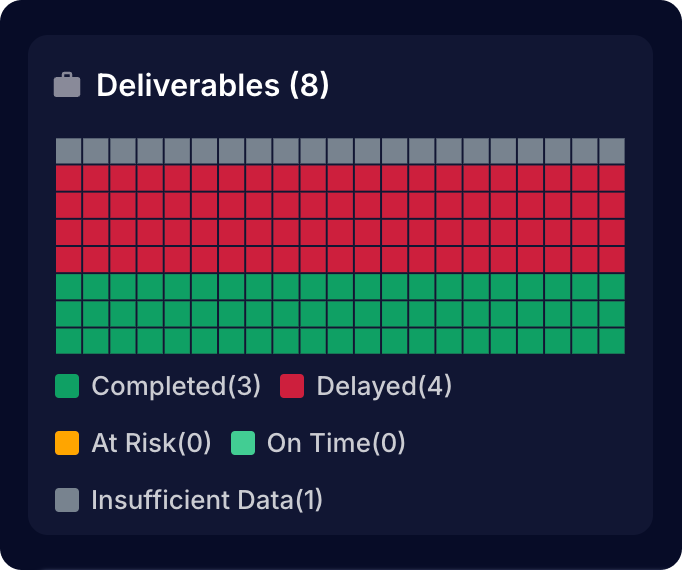
Deliverables 🎯
It shows all the tickets present within a deliverable.
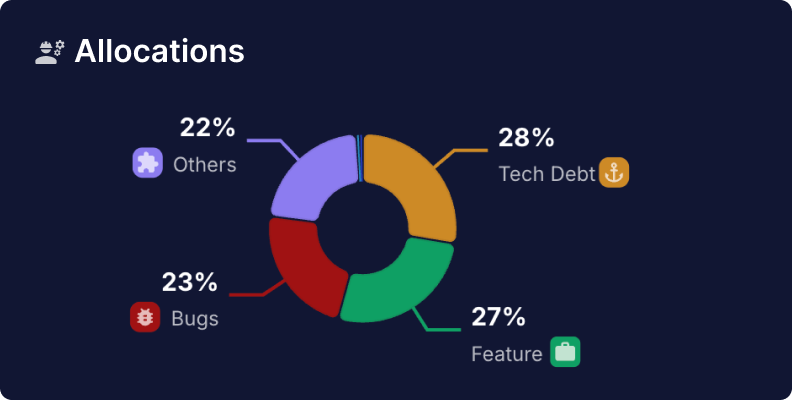
Allocations 📊
This shows the nature of work allocated to help you understand how much bandwidth is taken by each type of ticket distribution within this deliverable.
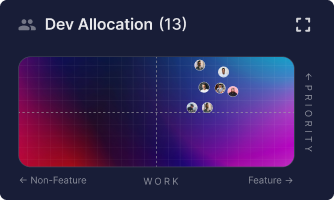
Dev Allocation 📊
You can understand what kind of work your developers are working on and how important that work is.
Timeline and Child Tickets 🎫
This contains all the child tickets of this deliverable with their status, POC, projections, and start & end dates. Each ticket is represented by a blob on the right section of the timeline.
You can sort and filter the tickets by your choice.

Pre-requisites for Optimal Usage 🛠️
This feature works best when:
- JIRA is linked, and all boards are synced.
- Start and end dates are present on epics.
- Story points are present on tickets.
- Ticket types are added to allocation categories.
Frequently Asked Questions 💬
What is a deliverable? 🎯
An epic on your JIRA Board is considered a deliverable here.
What if some epics are missing data? ❗
Tracking deliverables requires assignees, start & end dates. Middleware flags items missing data for your attention.

If you need any help or have any questions, you can write to contact@middlewarehq.com.