AI Baseline (Adoption & Impact)
Overview
AI Baseline is your org's AI impact dashboard. It shows:
- How widely AI coding tools (e.g., GitHub Copilot) are used and how adoption changes over time.
- Side-by-side delivery outcomes “with AI” vs “without AI.”
- Usage patterns by model, editor, and features.
- License utilization to optimize spend.
Use it to validate AI ROI, spot adoption gaps, and prioritize enablement or license changes.
Cloud • Available to users with Engineering Manager (and above) permissions.
What you'll learn
- Adoption momentum: weekly trends of active AI users and acceptance of AI suggestions.
- Delivery acceleration: changes in cycle time, review time, rework, and lead time with AI vs without AI.
- Quality and predictability: change failure rate, bugs %, planned vs spillover, sprint completion.
- Usage insights: most-used editors/models and feature usage; seats and activity to right-size licenses.
Prerequisites
- Connected code provider:
- GitHub (Gitlab, Cursor, etc. coming soon.)
- Required scopes:
- GitHub: read:org (for organization and license data).
- Optional: AI user tagging
- Tag who counts as an “AI user” to enable focused comparisons (AI-only vs Non-AI users).
Settings → Integrations → Code Provider. If prompted on the baseline UI, re-link to grant missing scopes.
Data sources
- Code provider activity (GitHub/etc.) for PRs, reviews, and repository context.
- AI usage events (e.g., code suggestions and acceptances) from the provider's AI interfaces where available.
- Organization license information (provider-specific).
- Active users and org settings (for AI user tagging).
Navigate
Product → AI → Baseline
The page includes:
- Header: date range, org selector (code provider org/group), user filter, and “Generate AI Analysis.”
- Tabs:
- AI Adoption & Trends
- Usage Insights
Filters and controls
- Date range: Focus the analysis window (weekly cadence).
- Code provider group: Choose the GitHub organization or GitLab group to analyze.
- Users filter:
- None: All users.
- AI users only (include): Only users tagged as AI users.
- Non-AI users (exclude): Everyone except tagged AI users.
Configure AI users in Settings → AI Users (or via the in-page “Configure AI Users” prompt). This enables apples-to-apples comparisons for velocity trends and speed metrics.
AI Adoption & Trends
What's included:
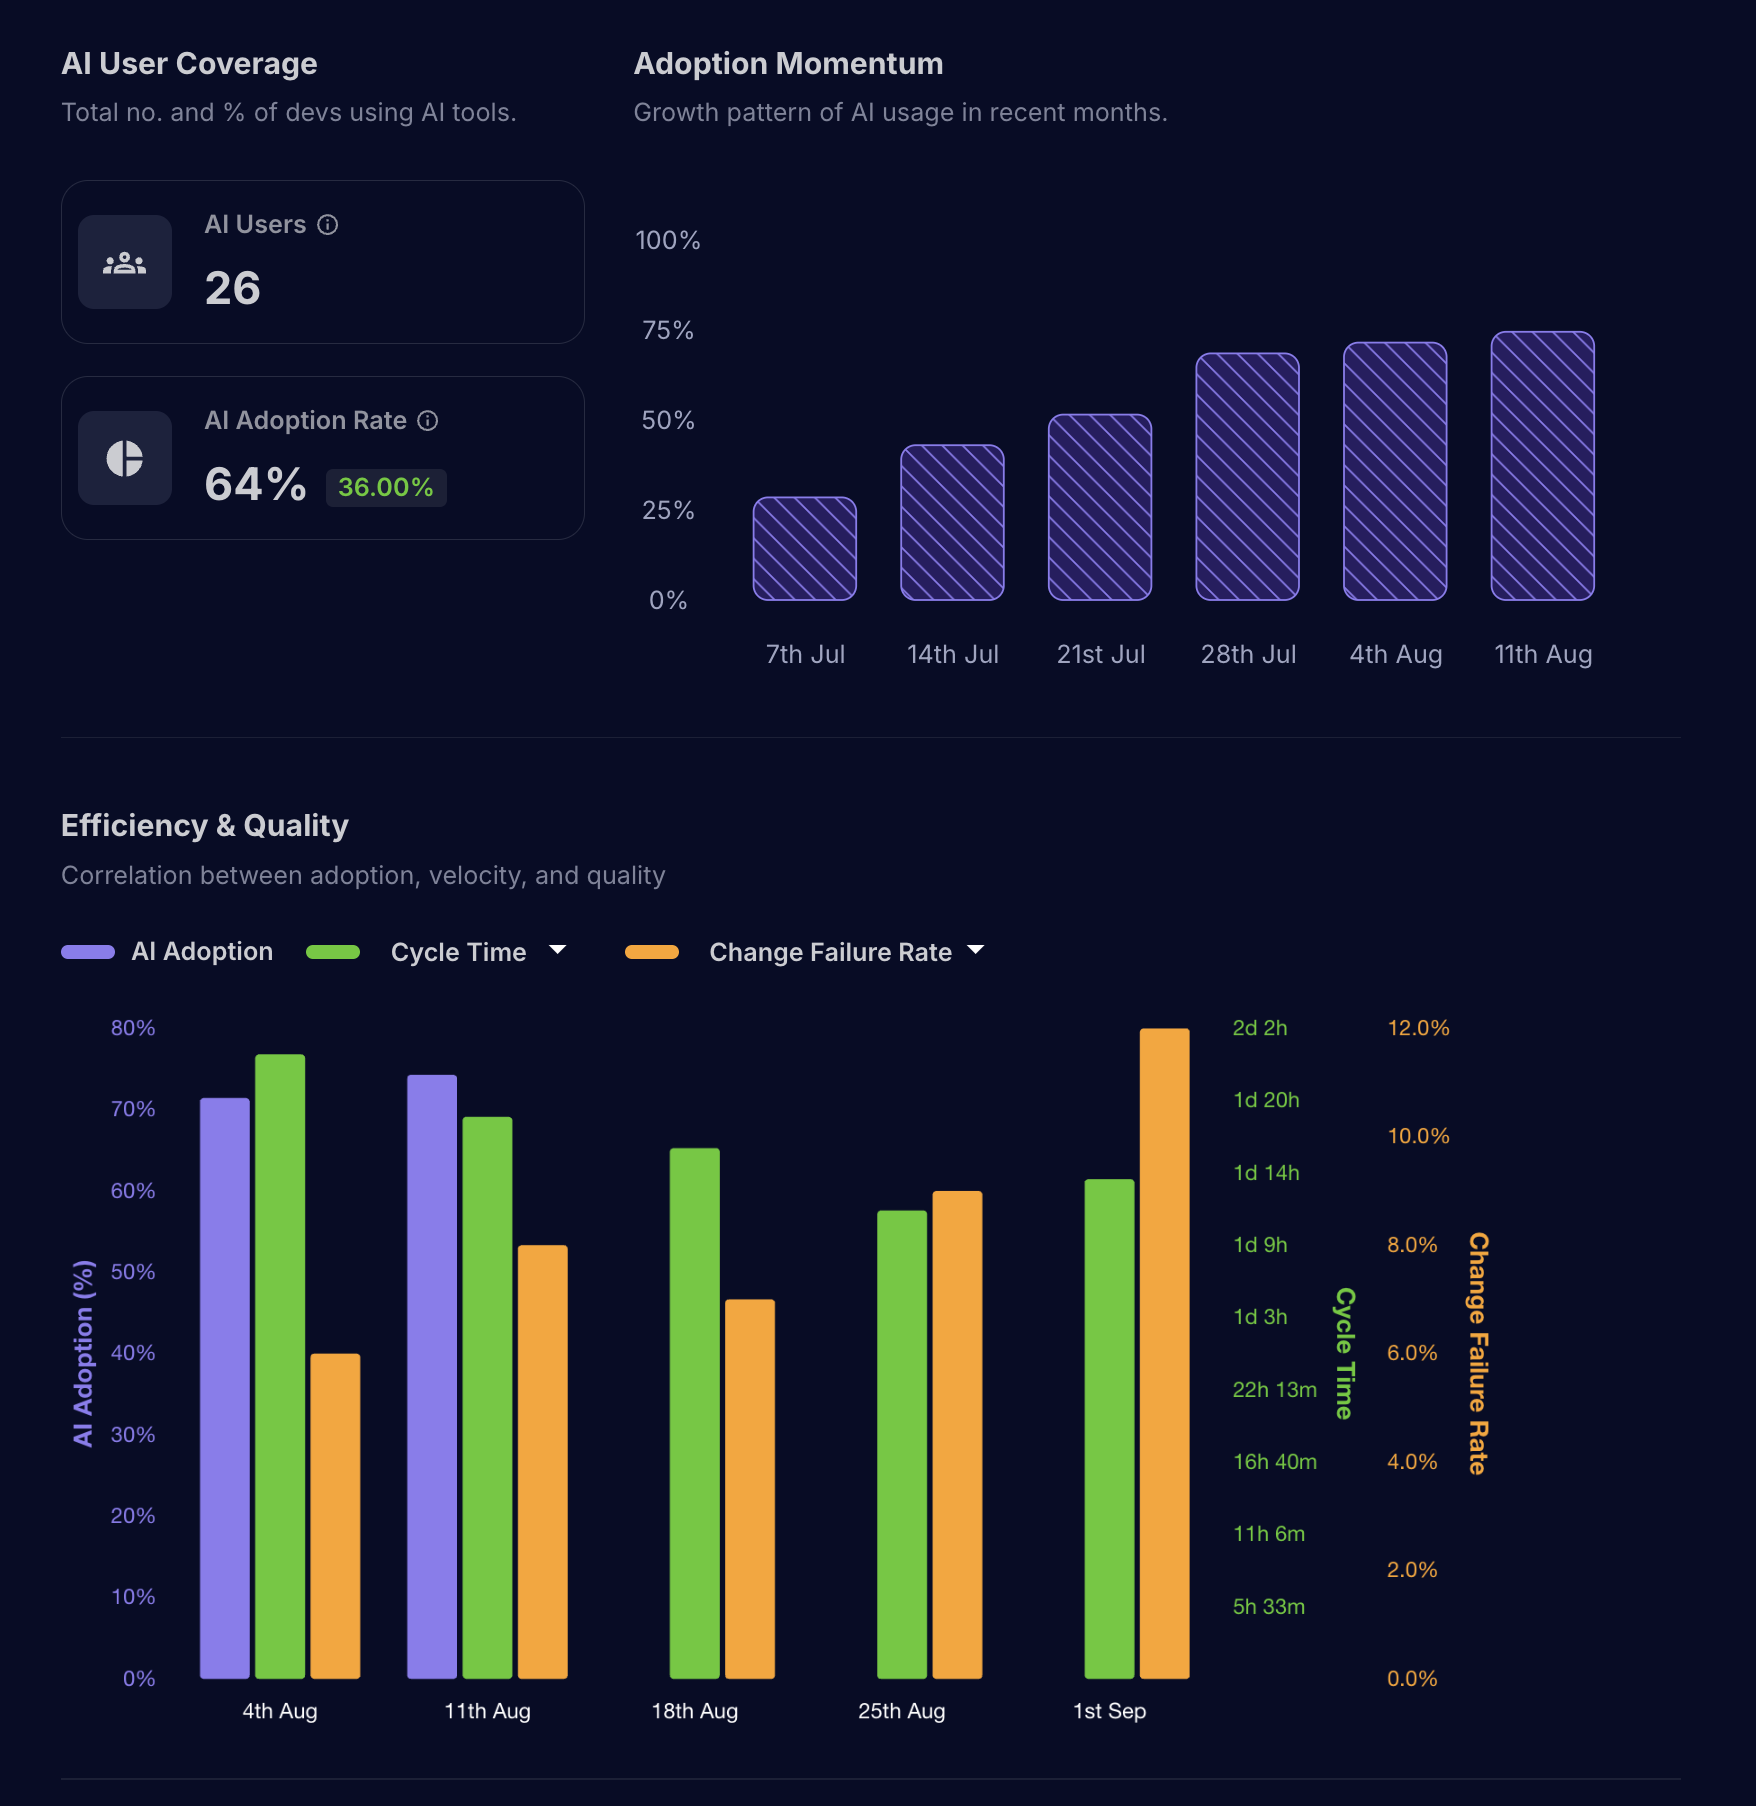
- Adoption momentum: Weekly view of active AI usage. When total users are known, the chart can show percentage of users engaging with AI.
- AI adoption rate: The peak weekly AI usage count during the period, divided by total active users (capped at 100%).
- Adoption rate change: Relative change from the first to the last week in the selected window.
- AI usage trends: Weekly counts of AI suggestions and acceptances.
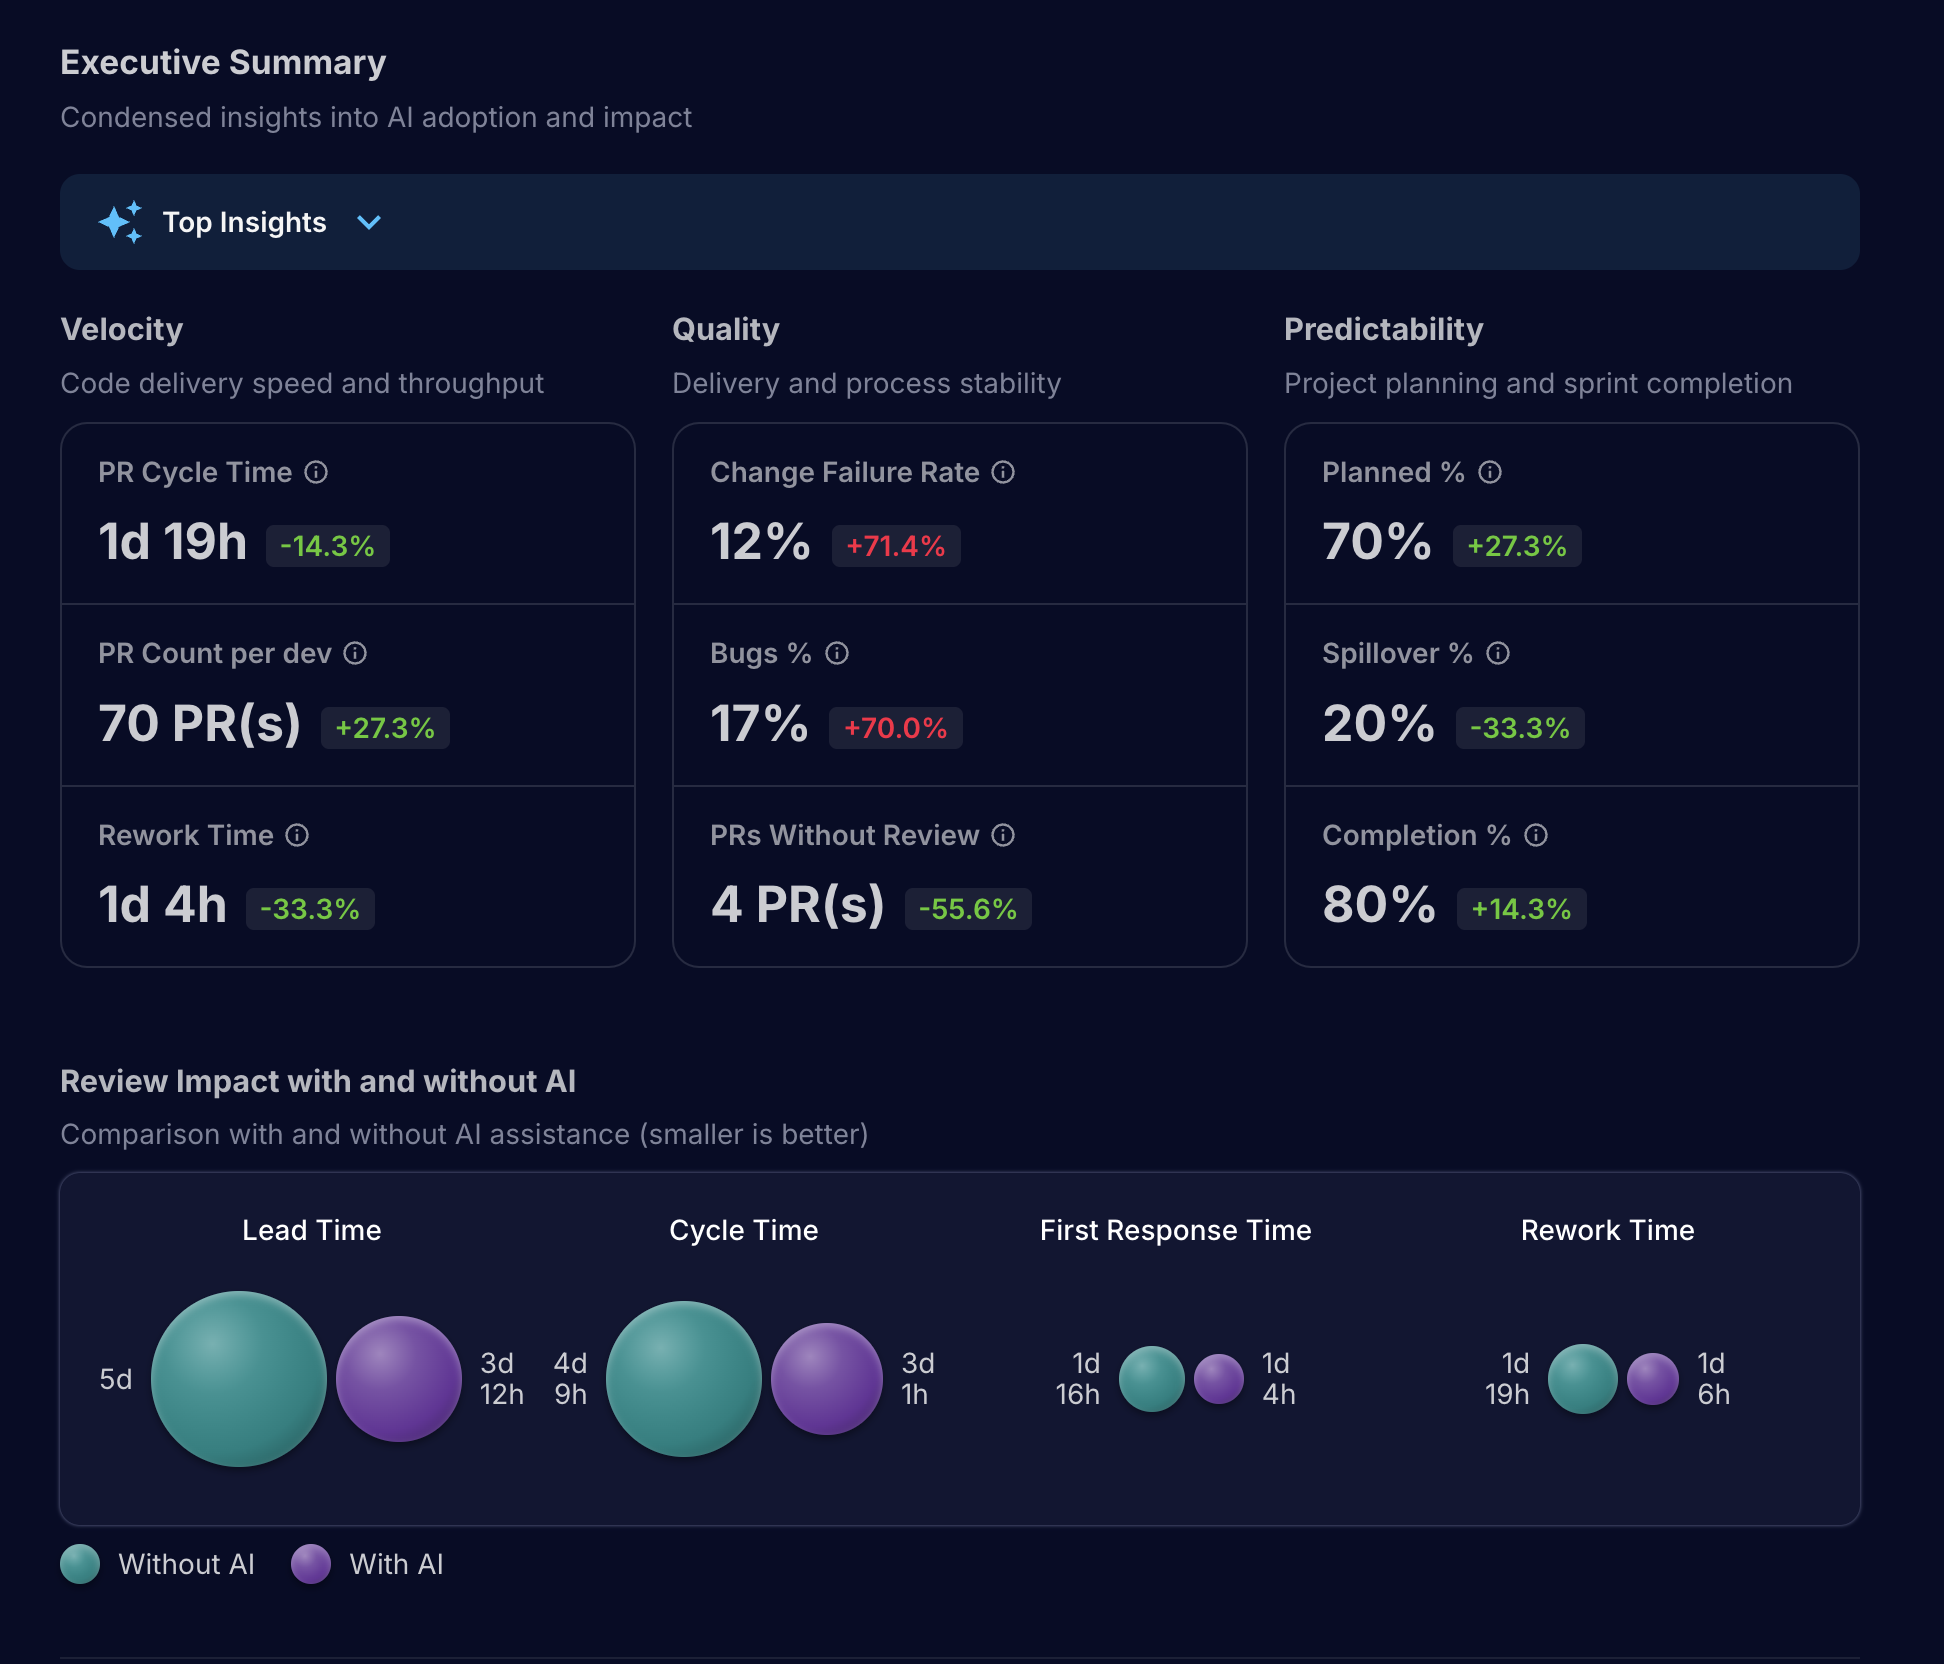
- Delivery acceleration (With AI vs Without AI):
- Cycle time
- First response time (time to first review)
- Rework time (iterations required)
- Lead time, Merge time, Merge-to-deploy
- PR count
- Executive summary:
- Speed: cycle time, first response time, rework time, PRs per developer.
- Quality: change failure rate, bugs percentage, PRs merged without review.
- Predictability: planned %, spillover %, sprint completion.
How “With AI” vs “Without AI” works
- Default mode: Aggregated impact based on the provider's AI signals for your org.
- AI-only/Non-AI-only modes: When an AI user filter is set, metrics are derived from the tagged user cohort (by mapping your tagged MHQ users to their code-host usernames).
Usage Insights
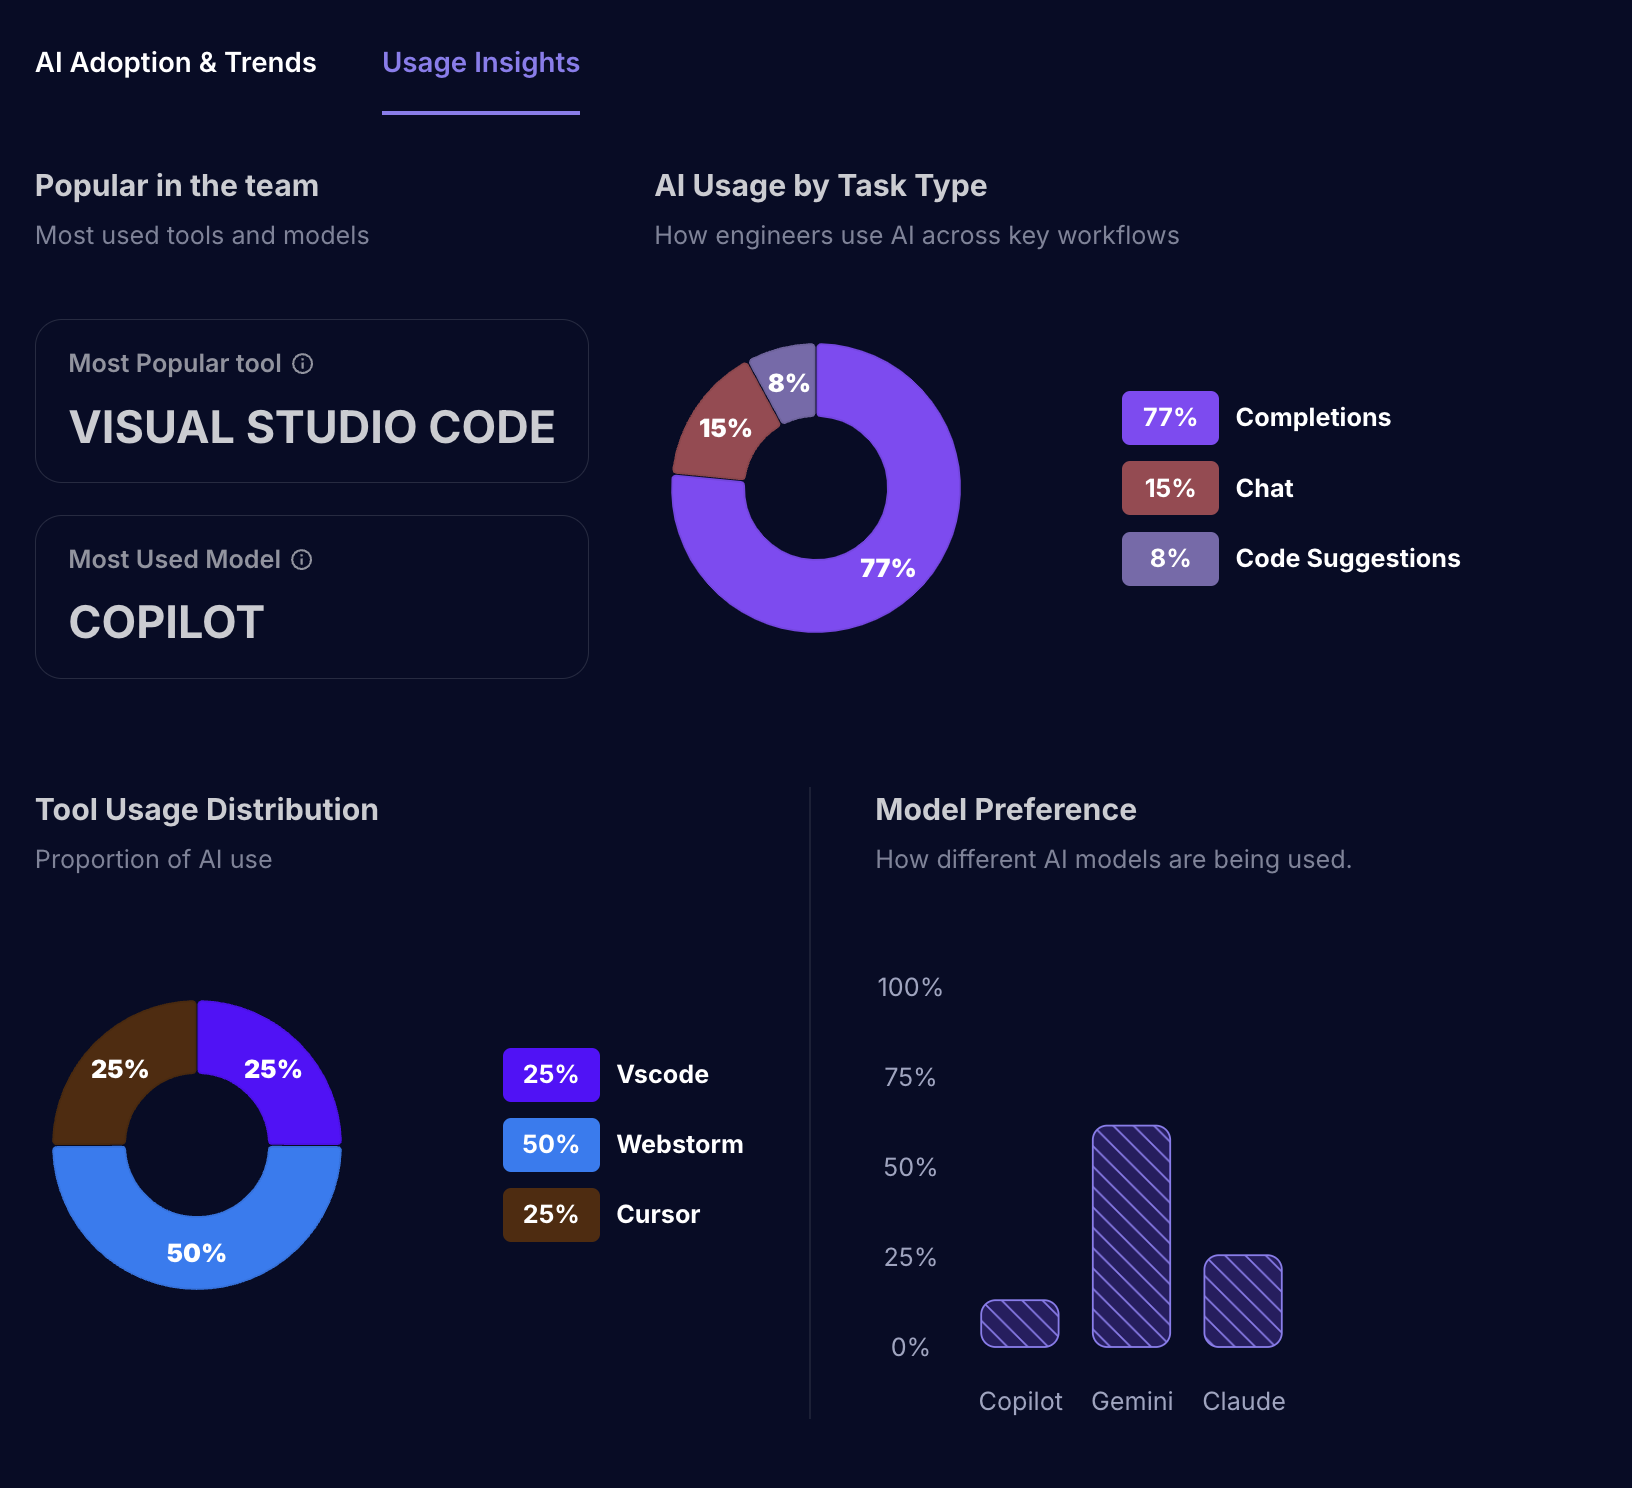
- AI usage breakdown:
- Model preference (e.g., Copilot, Gemini, Claude).
- Editor distribution (e.g., VS Code, WebStorm).
- Feature usage (e.g., chat, completions, code suggestions).
- License utilization:
- Total seats by org/group and activity recency.
- Per-user last activity to identify waste or opportunities to reassign seats.
Metric definitions
More detailed definitions here: Link
- AI adoption rate
- Definition: Max weekly AI usage count during the selected period ÷ total active users (in MHQ), expressed as a percentage (0-100).
- AI adoption rate change
- Definition: Relative change between the first and last period's adoption rate, expressed as a percentage.
- AI suggestions count / accepted
- Weekly counts of suggestions shown vs accepted by developers.
- Delivery metrics
- Cycle time: Time from first commit to merge (days).
- First response time: Time to first reviewer response (days).
- Rework time: Time spent in rework between review cycles (days).
- Lead time: Time from work start to merge (days).
- Merge time: Time from PR open to merge (days).
- Merge-to-deploy: Time from merge to production deployment (days).
- PR count: Number of PRs in the window.
- Executive summary
- PRs merged without review: Count of PRs merged without at least one review.
- Change failure rate: % of releases requiring remediation/rollback (org-specific).
- Bugs percentage: Share of tickets flagged as bugs.
- Planned percentage: % of tickets planned for the sprint/release.
- Spillover percentage: % of tickets that slipped to a subsequent iteration.
- Sprint completion: % completed in the planned window.
Time metrics are shown in days (rounded for readability). Trends are aggregated weekly.
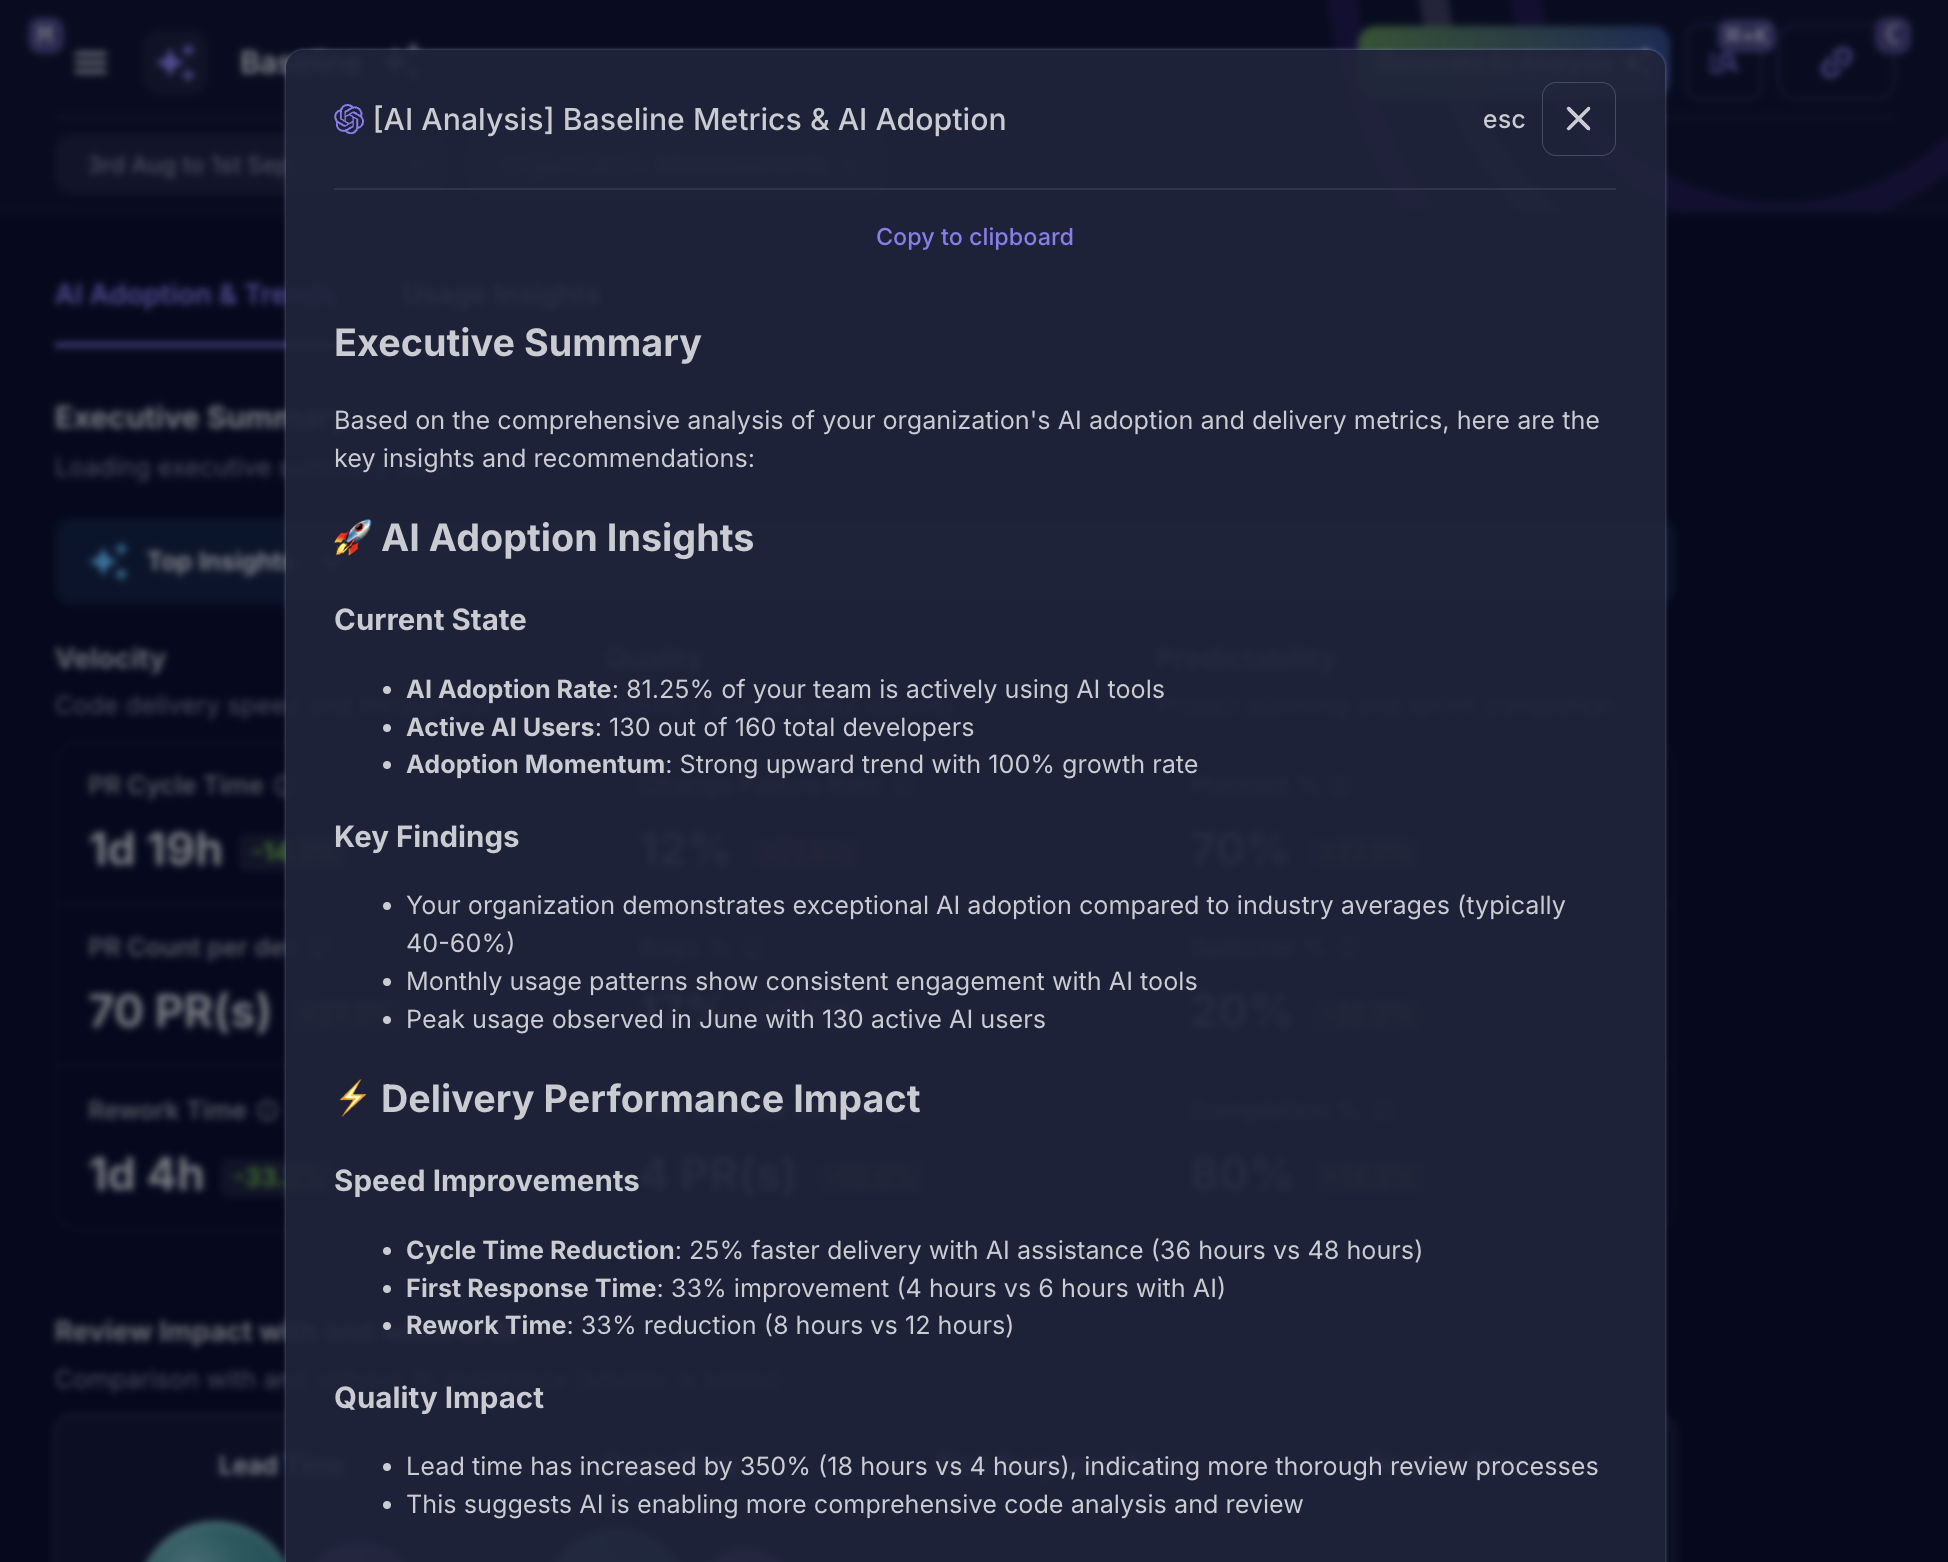
AI-generated summary
Click “Generate AI Analysis” to produce an executive-friendly summary of your org's adoption, trends, and impact, with actionable recommendations.
- Availability: Feature-flagged. Requires permission to share chart data with the AI summarization service.
- Output: Streamed narrative you can copy for status updates or reviews.
First-time walkthrough
The first time you land on Baseline, a short walkthrough highlights key insights and controls. Dismiss or revisit any time; your “seen” status is remembered per user.
Troubleshooting
- “GitHub Integration Required”
- Link your GitHub org under Settings → Integrations.
- “Missing required scopes”
- Re-link GitHub and grant the requested scopes (e.g., read:org).
- “No orgs connected”
- Ensure the integration has access to at least one organization/group.
- “No AI activity detected yet”
- You'll see insights once developers start using AI coding tools and the provider emits usage signals.
- “No AI Review data”
- If you're comparing “With AI Review” vs “Without,” ensure your teams use AI reviewers (e.g., GitHub Copilot PR review).
Permissions and roles
- Minimum role: Engineering Manager (or higher).
- Org admins can manage integrations, scopes, and AI user tagging.
Limitations
- Data availability varies by provider and scope grants.
- AI user comparisons depend on accurate AI user tagging and identity mapping to code-host usernames.
- Some quality/predictability metrics depend on your project/ticketing integrations and configuration.
Best practices
- Start with a recent 4 week window to establish a baseline.
- Tag AI users to run clean comparisons, then expand tagging as adoption grows.
- Use the executive summary for leadership updates; drill into trends to prioritize enablement.
Related topics
- DORA metrics: /product/cloud/dora/dora-metrics
- Roadmap: /product/cloud/roadmap
- Metrics Explained: /product/metrics-documentation
Last updated: 2025-09-01