Workflow Loops
Workflow Loops shows you every time a Jira ticket moved backward in your workflow — from a later state back to an earlier one. If your team is spending time on rework you can't quite pinpoint, this widget tells you exactly where the churn is coming from and where it lands. Find it on the Project Overview page, scoped to your selected board, sprint, and date range.
What Are Workflow Loops?
A workflow loop (also called a regression) occurs when a Jira ticket moves from a later workflow state back to an earlier one — for example, a ticket in QA that gets pushed back to In Progress, or a ticket in Code Review that returns to In Progress after failing review. Each such backward transition is counted as one loop.
Loops are a reliable signal of rework and process friction. A single loop isn't cause for alarm — but patterns of loops concentrated in specific state transitions often reveal systematic issues: unclear acceptance criteria, unstable code, ambiguous review standards, or handoff gaps between teams.
Workflow Loops helps you move from "we seem to be doing a lot of rework" to "here's exactly where work is getting rejected and why."
Where to Find It
Workflow Loops is a widget on the Project Overview page, below the main analytics section. It automatically reflects the board, sprint, and date range you've selected at the top of the page. Switching filters updates the visualization in real time.
Reading the Visualization
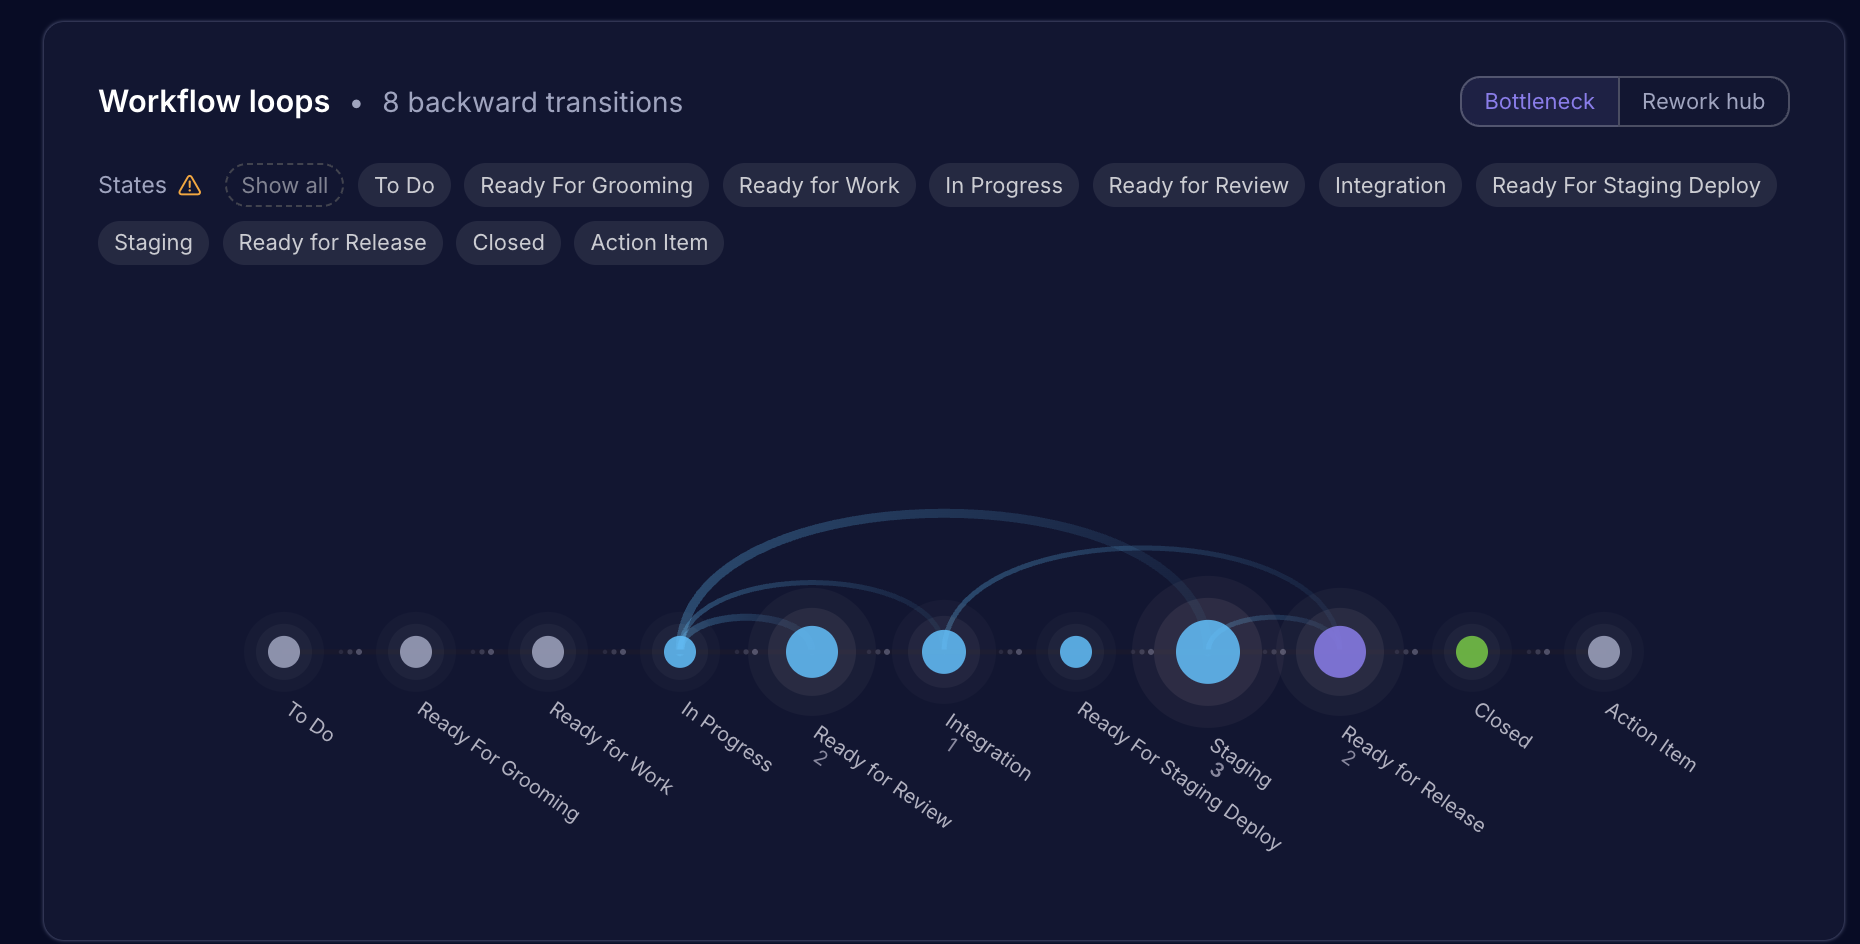
The widget uses a caterpillar chart — a horizontal spine of circular nodes representing each state in your workflow, connected by arcs that represent backward transitions.
  [Arc: QA → In Progress, 4x]
          ╭──────────────╮
          │              │
  ● ─── ● ─── ● ─── ● ─── ● ─── ●
 To Do  In    Code  QA  Staging Done
        Prog  Rev   3
Beads (Nodes)
Each circle on the spine represents a workflow state.
- Bead size reflects regression activity — larger means more regressions either originating from or arriving at that state (depending on the active view mode).
- Bead labels show the state name and its regression count.
- Bead colors correspond to state type: cyan for Todo, orange for In Progress, purple for QA/Review, green for Done, red for Blocked.
Arcs
Curved lines arching above the spine represent backward transitions between two states.
- Thickness reflects volume — a thicker arc means more tickets made that specific backward move.
- Color matches the source state (where the ticket was when it regressed).
- Direction always flows right-to-left (from a later state back to an earlier one).
Hover over an arc to see a label showing the exact transition and how many times it occurred (e.g., "QA → In Progress, 4 times").
The Two View Modes
Toggle between views using the Bottleneck and Rework Hub buttons in the top-right corner of the widget.
| Mode | Bead size reflects | Best used for |
|---|---|---|
| Bottleneck | Outgoing regressions — how often work leaves a state backward | Finding where work gets rejected |
| Rework Hub | Incoming regressions — how often a state receives work back | Finding where rework lands |
Example: If QA is your bottleneck, it will appear large in Bottleneck view because it's sending tickets back frequently. The states receiving those tickets (typically In Progress) will appear large in Rework Hub view.
Use both views together for a complete picture: Bottleneck tells you who's rejecting, Rework Hub tells you who's absorbing the cost.
Interacting with the Widget
Hovering a Bead
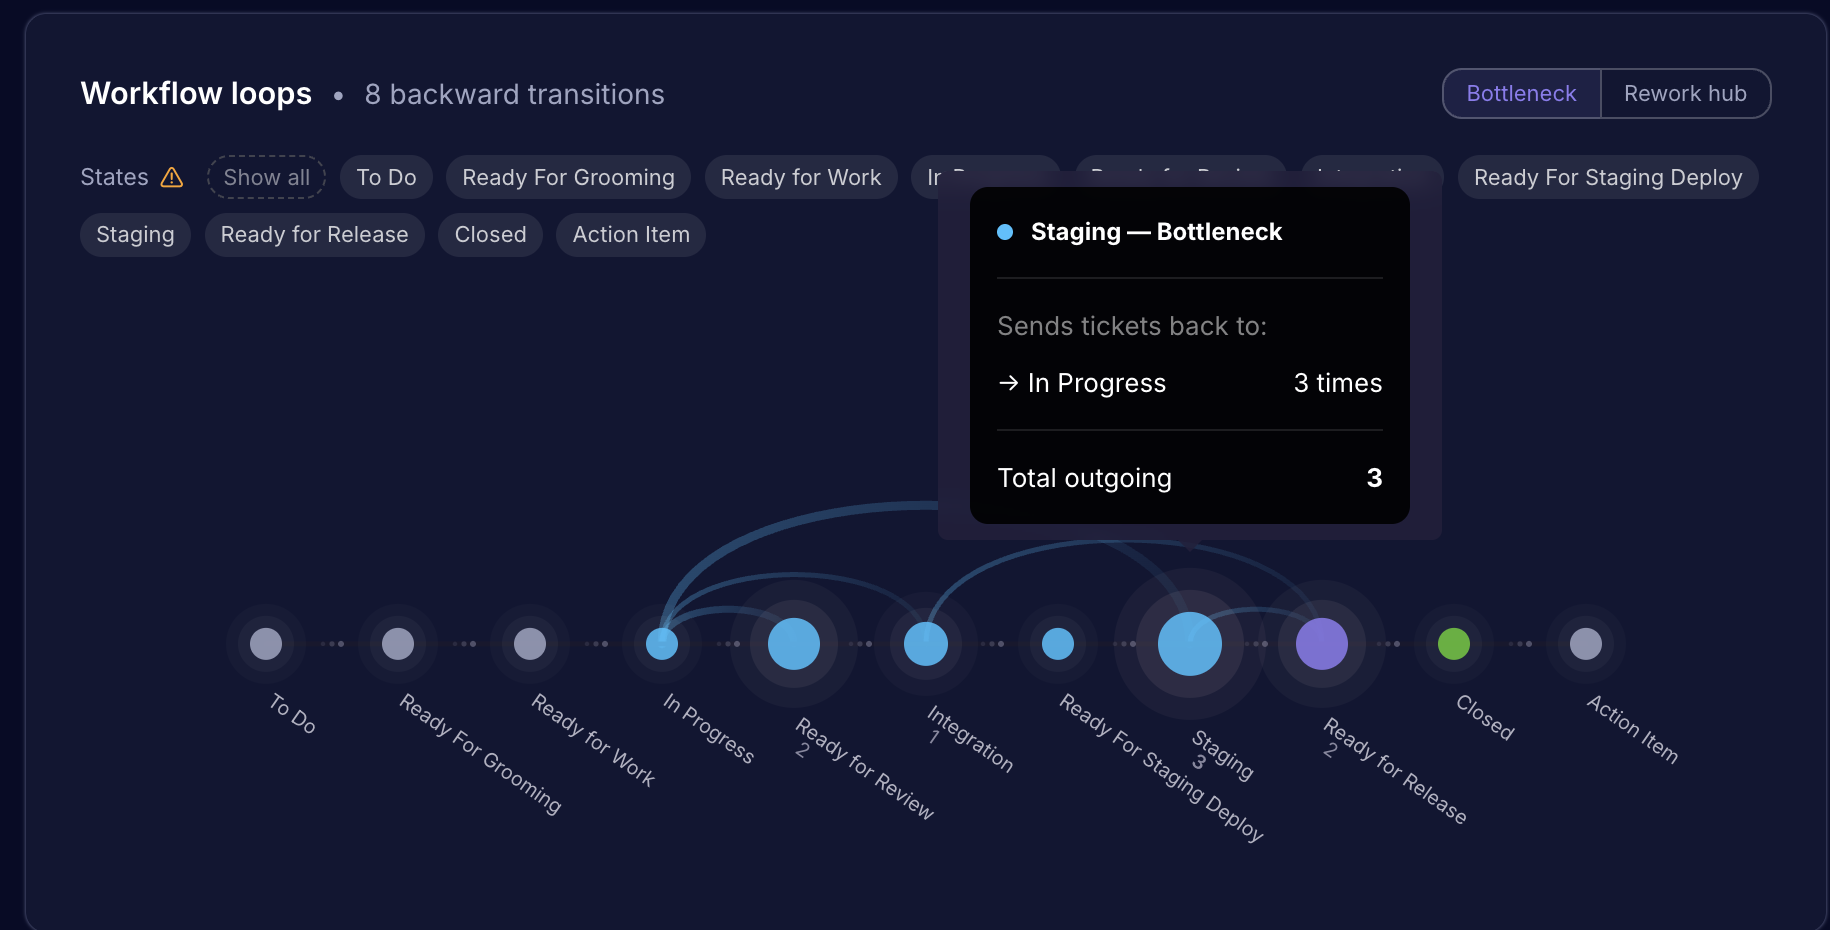
Hovering over a state node shows a tooltip with:
- Total regressions — total backward transitions involving this state
- Affected tickets — number of distinct tickets that regressed through this state
- Regression density — regressions per affected ticket (how repeatedly each ticket looped through)
Regression density is particularly useful: a state with 20 regressions across 20 tickets is very different from 20 regressions across 5 tickets. The latter signals a chronic blocker.
Hovering an Arc
Hovering an arc surfaces labels at each endpoint showing the specific transition and its count — for example, "Staging → In Progress, 3 times."
Clicking an Arc
Clicking any arc opens a drill-down panel listing the specific tickets that made that backward transition. Use this to investigate root causes at the ticket level.
State Filter Pills
Below the chart header, each workflow state appears as a clickable pill. Click to show or hide individual states and their arcs.
- At least 2 states must remain visible at all times.
- Toggle Active only to hide states with zero regressions and focus on the states where loops are actually occurring.
Summary Bar
At the top of the widget, a summary bar shows the total number of backward transitions detected for the current filter selection.
If your dataset exceeds 2,000 tickets, a yellow truncation warning appears. This means results are based on a sample and may not reflect the full picture. Consider narrowing your date range or filtering to a specific sprint to get complete data.
Clean States
| Situation | What you'll see |
|---|---|
| Filters are applied, but no regressions occurred | Green banner: "Clean run — Zero backward transitions" |
| No data available for the selected board | Neutral message: "No workflow loops detected for this board" |
A clean run is a good sign — it means work progressed forward through your workflow without getting sent back.
Unmapped States Warning
If a workflow state exists on your Jira board but hasn't been mapped in Middleware, a warning icon (⚠) appears next to the "States" label in the filter bar. Unmapped states won't appear in the visualization, which means regressions involving those states won't be counted.
Click the warning icon to navigate directly to the workflow state mapping settings where you can resolve this. Accurate state mapping is important for getting reliable regression data.
Interpreting the Data — Practical Guidance
The chart tells you what is happening. Here's how to interpret why and what to do about it.
High QA → In Progress regressions
This typically signals one of:
- Code quality issues — bugs are reaching QA that should have been caught earlier
- Unclear acceptance criteria — QA is rejecting work that wasn't well-defined to begin with
- Missing test coverage — developers are shipping without sufficient self-testing
Action: Review rejected tickets for common failure patterns. Consider adding definition-of-done criteria or shifting QA left with earlier code review.
High In Review → In Progress regressions
A persistent loop between Code Review and In Progress often points to:
- Inconsistent PR standards — reviewers have different bars for approval
- Large, hard-to-review PRs — reviewers request multiple rounds of changes
- Knowledge gaps — authors are unclear on what "review-ready" means
Action: Document and align on PR standards. Consider setting PR size limits or adding a pre-review checklist.
High regression density on a specific state
If regression density (regressions per affected ticket) is high on a state, some tickets are going through that state multiple times. This is often worse than a high total regression count — it means the same work is repeatedly failing at the same gate.
Action: Identify the specific tickets with the highest loop counts (use the arc drill-down) and investigate what they have in common.
Using both views together
Start with Bottleneck view to identify which state is the source of most rejections. Then switch to Rework Hub to understand which state absorbs the rework — often a different team or role is bearing the cost of upstream problems. This asymmetry between source and destination is often where process conversations need to happen.
Data Scope and Limitations
- Data reflects the selected board, sprint, and date range only.
- Only backward transitions are visualized. Forward progression through the workflow is not shown.
- Results are capped at 2,000 tickets. If your dataset exceeds this, a truncation warning is shown — narrow your filters to get complete data.
- States that are not mapped in Middleware will be excluded from the visualization. Resolve this via the workflow state mapping settings (see warning icon above).
Common Questions
Why do I see a truncation warning?
The widget processes up to 2,000 tickets at a time. If your selected date range or board contains more than that, results are based on the most recent 2,000 tickets and the full picture may be incomplete. To resolve this, narrow your date range, filter to a specific sprint, or scope to a smaller subset of the board.
What's the difference between Bottleneck and Rework Hub?
Both views show the same underlying regression data — they just resize the beads differently.
- In Bottleneck view, large beads are states that send work backward most often. Think of them as rejection points.
- In Rework Hub view, large beads are states that receive work back most often. Think of them as the places where your team absorbs rework.
The same state can be prominent in both views — for example, In Progress is frequently the destination of regressions (Rework Hub) and may also send work backward if it's re-opened and pushed back again (Bottleneck).
What does regression density mean?
Regression density is the number of regressions divided by the number of distinct tickets affected. A density of 1.0 means each ticket looped through that state once. A density of 3.0 means, on average, each affected ticket looped through three times.
High density is often a stronger signal of a process problem than high volume alone. A state with 10 regressions across 10 different tickets might be normal variation. A state with 10 regressions across 3 tickets means those tickets are stuck in a cycle — that's worth investigating.
What counts as a backward transition?
Any state change where a ticket moves to a state that appears earlier in the configured workflow order. The order is determined by your Jira workflow configuration and how states are mapped in Middleware. If a state isn't mapped, transitions involving it won't be counted.