Story points in Actual Time and Trends
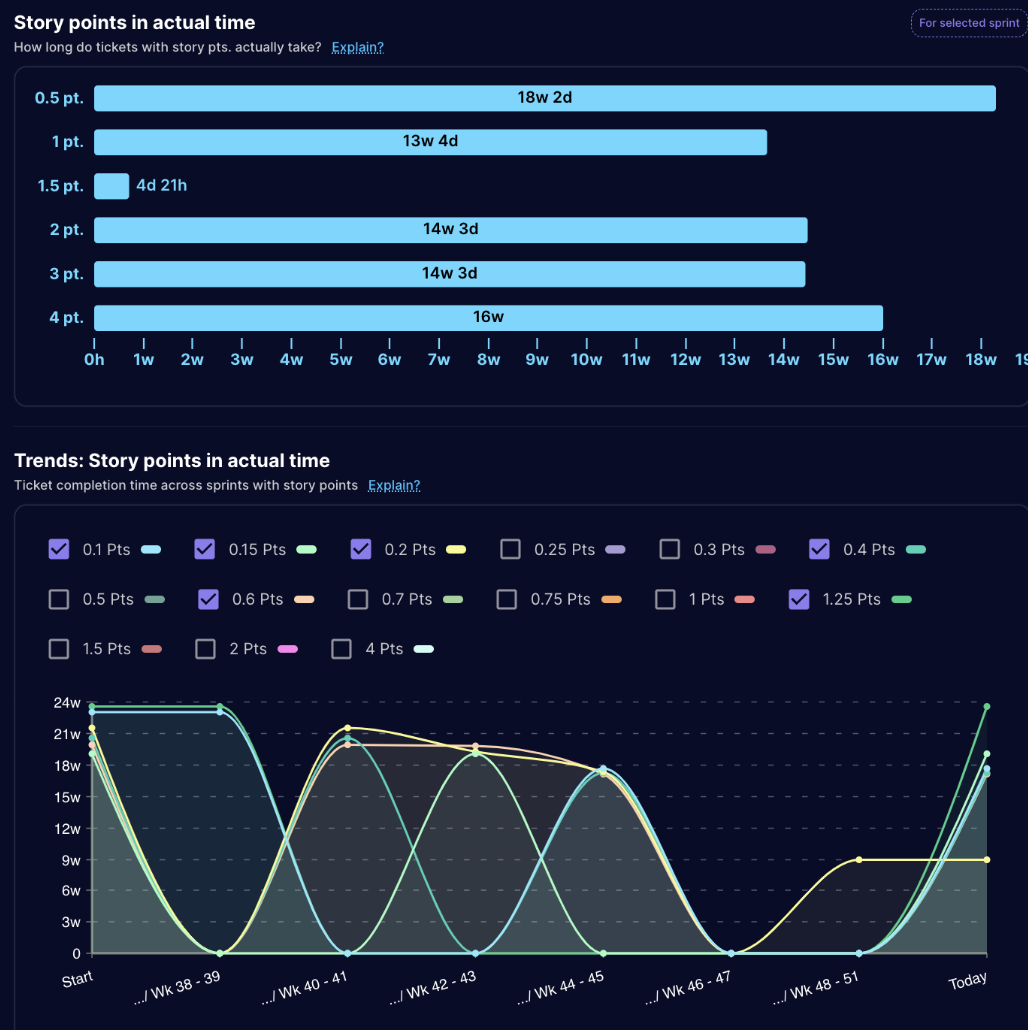
The Story Points in Actual Time metric within the Sprint Reports for Jira app helps teams compare the estimated effort (represented by story points) with the actual time spent completing user stories. This metric is often accompanied by trend charts to provide a broader perspective on how story point estimates and completion rates evolve over time.
Understanding the Story Points in Actual Time
- This metric typically displays the average time spent per story point (e.g., hours, days) across a specified timeframe (e.g., sprint, project).
- By comparing the estimated and actual time, teams can identify potential discrepancies between their initial estimates and the actual effort required to complete stories.
Benefits of Analyzing the Metric
- Improved Story Point Estimation: Analyzing the historical data allows teams to refine their estimation process by understanding how their story point assignments have translated into actual time spent. This can lead to more consistent and accurate estimates in the future.
- Realistic Sprint Planning: By having a better understanding of the relationship between story points and actual time, teams can plan their sprints more realistically by assigning an appropriate number of story points based on their capacity and historical data.
Accompanying Trend Charts
Story Points Completion Rate
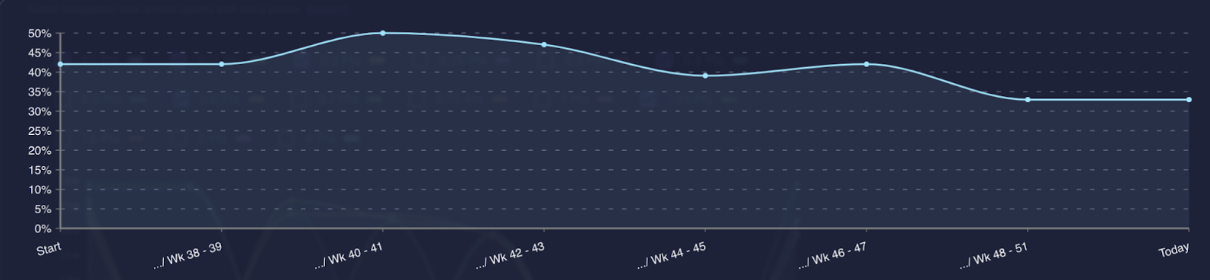 This chart tracks the percentage of story points completed within a specific timeframe.
Story Points Assigned vs. Shipped
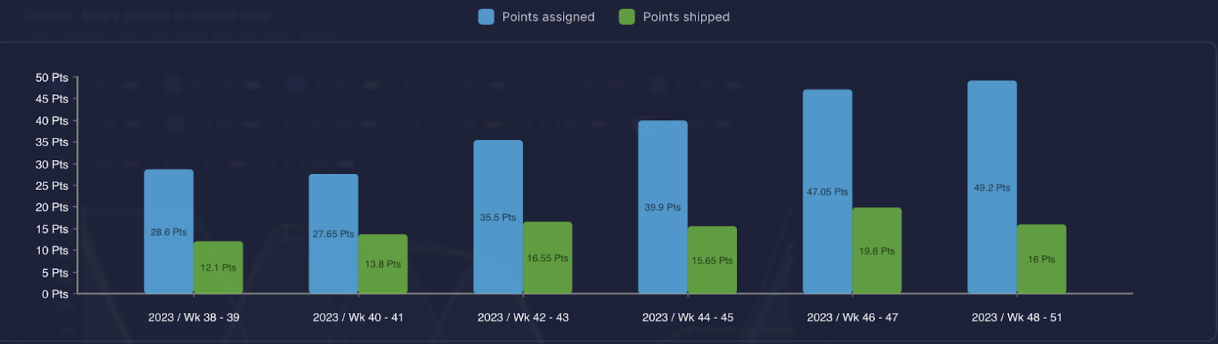 This chart visually compares the number of story points assigned to a sprint with the number of story points
actually completed and shipped.
This chart visually compares the number of story points assigned to a sprint with the number of story points
actually completed and shipped.
Sprint Velocity
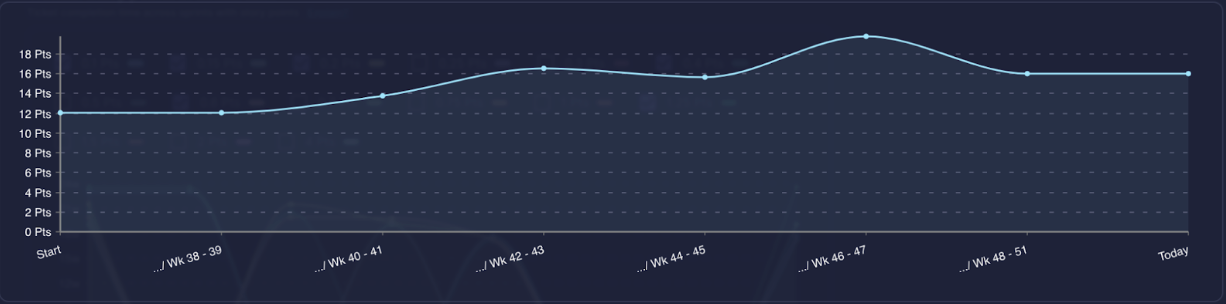 This chart depicts the average number of story points completed per sprint, helping assess team capacity and
track progress over time.
This chart depicts the average number of story points completed per sprint, helping assess team capacity and
track progress over time.
Interpreting the Trends
Analyzing trends alongside the average time spent per story point allows teams to identify:
- Patterns and consistencies in the relationship between estimates and actual effort.
- Improvements in estimation accuracy over time.
- Areas for further refinement in the estimation process.
Additional Considerations
- It's important to remember that story points are relative estimates, not exact measurements of time.
- Various factors, such as complexity, team experience, and external dependencies, can influence the actual time spent on a story, even with accurate estimates.
- Continuously monitoring and analyzing these metrics helps teams calibrate their story point system and improve their overall estimation and planning practices over time.
By effectively utilizing the Story Points in Actual Time metric and its accompanying trend charts, teams can:
- Gain valuable insights into the relationship between story points and actual effort.
- Refine their estimation process for greater accuracy and consistency.
- Plan their sprints more effectively based on realistic capacity assessments.
- Enhance their overall project delivery performance through continuous improvement.