
How to Create Flexible and Custom Reports, Charts, and Graphs in Jira?


9 min read

Table of Contents
- How to Create Reports in Jira?
- Types of Reports in Jira
- Tips for Creating Effective Reports
- How does Creating Tables and Graphs Reports from Jira help?
- How to Set Up Your Jira Dashboard?
- Creating Custom Reports in Jira
- Building Custom Charts in Jira
- Advanced Graphs in Jira with Add-Ons
- Sharing Your Jira Reports and Dashboards
- Tips for Effective Jira Reports and Dashboards
- Conclusion
- FAQs
Jira is a powerful tool used to track project progress, manage workflows, and collaborate with teams. But let’s face it, if you’re unable to turn all that data into actionable insights, it’s just a bunch of numbers and task lists. That’s where Jira’s reporting, charts, and graphs come in. They transform raw data into visual representations that can help you track your project’s health, spot bottlenecks, and make better decisions.
So, if you’ve ever wanted to create flexible and custom reports, charts, and graphs in Jira that suit your team’s specific needs, you’re in the right place. In this blog, we’ll walk through everything you need to know to start creating custom reports and dashboards in Jira—no fancy coding skills are required.

Middleware Jira Sprint Reports Plugin is designed to give you detailed sprint analysis and reporting capabilities. It helps you track your team's progress, visualize sprint performance, and manage backlogs efficiently, providing deeper insights into sprint trends and bottlenecks.
How to Create Reports in Jira?
To generate a report in Jira, follow these steps:
Choose the Type of Report You Want to Generate
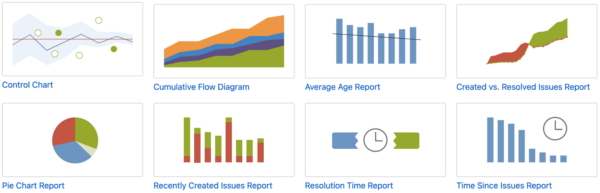
Choose the data you need to access. Navigate to the required project and tap on Reports. Choose the report you want to create.
Configure Your Report Settings
For most reports, you can choose the project and a date range using intervals (days, weeks, months, quarters).
Report settings vary. For instance, the pie chart report provides issues categorized by a particular field according to chosen filters (project, assignee, status, priority, etc.)
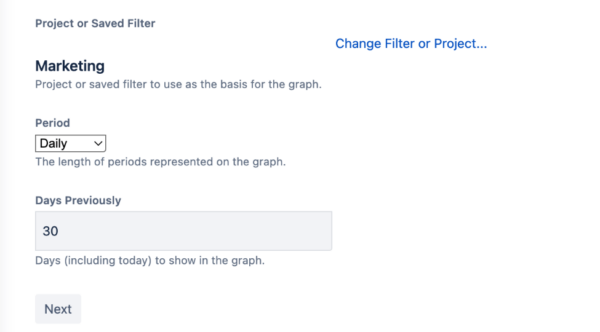
A preview of the date range intervals you can choose from
Add Jira Reports to Jira Dashboard
Built-in Jira reports work best on dashboards. These reports stay visible on your dashboard after being added. To see all charts, create or update a dashboard and select Charts in the Gadget search.
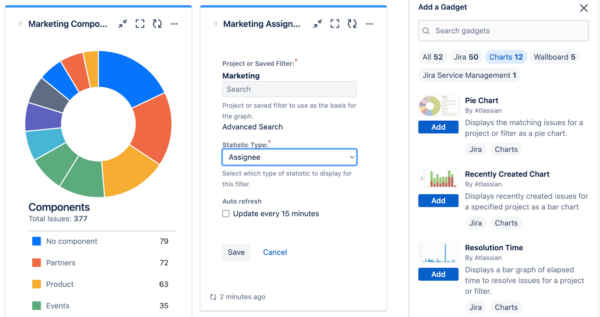
An example of a Jira dashboard displaying available reports
Note: In team-managed projects, please be aware that a report will only be available to view if there is sufficient data to display.
To view a report for your team-managed project, navigate to your project and select Reports from the project menu. For more information, click here .
Access Project Settings: Navigate to your project's settings.
Enable Reports: Under the Features section, ensure reports are enabled.
Go to Reports: Find the Reports option in the sidebar.
Select a Report: Choose from various report types based on your needs.
You can also leverage Jira dashboards and gadgets to track essential project metrics efficiently.
Types of Reports in Jira
Jira Service Management Reports: Monitor service-level agreements (SLAs) and support performance.
Risk Report: Identifies and analyzes potential project risks.
Sprint Overview Report: Provides insights into sprint progress and retrospectives.
Cumulative Flow Diagram: Visualizes issue status over time for workflow optimization.
Burndown Chart: Tracks completed vs. remaining work in a sprint.
Forecast & Management Reports: Assists in workload distribution and time tracking.
Tips for Creating Effective Reports
Utilize the Issue Navigator to filter and refine data.
Integrate Jira with business intelligence (BI) tools using connectors.
Automate report scheduling for timely insights.
Export reports in CSV format for external analysis.
How does Creating Tables and Graphs Reports from Jira help?
You must be wondering, why bother customizing reports, charts, and graphs in Jira? Well, the default reports are great, but they’re not always tailored to your specific workflow or team. Custom reports give you:
Personalized insights: You can focus on the metrics that matter most to your team and project goals.
Data clarity: Visualizing data in charts and graphs makes it easier to spot trends, bottlenecks, and areas that need improvement.
Better decision-making: Real-time data is key to making informed, data-driven decisions.
Whether you're a project manager, product owner, or team lead, custom Jira reports help you track progress, performance, and potential risks in a way that makes sense for your team.
How to Set Up Your Jira Dashboard?
Before you create custom reports, it’s worth setting up your Jira dashboard. This is where all the magic happens. A dashboard allows you to consolidate multiple reports, charts, and graphs into one centralized view.

How to Set Up a Dashboard:
Go to your Jira home screen and click on the Dashboards dropdown menu at the top.
Select Create New Dashboard.
Give your dashboard a name (something like "Team Progress" or "Sprint Health").
Choose the layout (you can pick from a range of grid layouts depending on how you want to organize your widgets).
Add the necessary permissions (who will be able to view/edit the dashboard).
Click Create.
For more information, click here.
Now you’ve got a clean slate to add your custom reports, charts, and widgets.
Also read: How to Effectively Use Jira and Confluence for Project Management?
Creating Custom Reports in Jira
Reports are a great way to understand what’s going on with your team, and in Jira, you can easily create custom ones based on the data you need.
Using Jira Query Language (JQL)

The most powerful tool for customizing reports in Jira is JQL (Jira Query Language). With JQL, you can create precise queries to pull up exactly the information you want. For example:
Find all open issues assigned to a particular team member:
assignee = "John Doe" AND status = "Open"List all tasks in a specific sprint:
sprint = "Sprint 5" AND project = "Project A"
To create a report:
Go to the "Issues" tab at the top of your Jira dashboard.
Click on Search for issues.
Write your JQL query in the search bar to filter the issues as needed.
After your query results are displayed, click on Save as and name your filter.
You can then add this filter to your dashboard as a widget or even export the results to Excel or CSV for further analysis.
Building Custom Charts in Jira
Charts are one of the best ways to visualize your data, especially for tracking progress over time or comparing multiple data sets. Jira lets you create several types of charts, including pie charts, bar charts, and more.
How to Create a Chart Widget:
From your dashboard, click Add a new gadget (this button is usually located on the top right of your dashboard).
In the gadget directory, select Pie Chart, Created vs. Resolved Chart, or whatever chart type you want to use.
For each chart type, you’ll need to configure it:
Pie Chart: Select a filter (you can use one of your saved filters) and decide which field to group the data by (e.g., priority, assignee, or status).
Created vs. Resolved Chart: Choose a filter and set the time frame (e.g., weekly, monthly) to show a comparison of issues created vs. issues resolved.
Click Add gadget once you’re happy with the configuration.
Also read: The Best Jira Plugins for Technical Project Managers
Advanced Graphs in Jira with Add-Ons
While Jira’s native reporting features are great, sometimes you need a little more power for advanced graphs and reporting. That’s where add-ons come in.
Popular Add-ons for Custom Reporting and Graphing:
EazyBI Reports and Charts – EazyBI is an incredibly powerful tool that lets you build detailed custom reports, charts, and even dashboards from Jira data. It uses a drag-and-drop interface for easy report creation.
Arsenale Dataplane – Dataplane offers pre-built and highly customizable reporting tools for Jira. It’s great for generating complex, ad-hoc reports that pull data from multiple sources.
Jira Software’s Tempo Timesheets – If you're looking to track time and project budgets, Tempo Timesheets provides excellent time-tracking reports that can be customized.
Custom Charts for Jira – This add-on allows you to create tailored visualizations and reports with advanced charting options (e.g., line charts, stacked bar charts).

Middleware Jira Sprint Reports Plugin – The Middleware Jira Sprint Reports Plugin is designed to give you detailed sprint analysis and reporting capabilities. It helps you track your team's progress, visualize sprint performance, and manage backlogs efficiently, providing deeper insights into sprint trends and bottlenecks.
Also read: The Hidden Costs of Manual Sprint Reporting: How Automation Can Save You 8+ Hours Every Week
These tools open up a whole new world of possibilities for reporting and charting, making Jira much more flexible for teams with advanced needs.
Sharing Your Jira Reports and Dashboards
Once you’ve set up your Jira reports and charts, the next step is sharing them with your team or stakeholders. Fortunately, Jira makes this simple:
Share the dashboard link with team members.
Export reports as PDFs, CSVs, or Excel files for offline use or further analysis.
For advanced sharing, you can even set up scheduled reports to be automatically emailed to stakeholders at regular intervals.
Tips for Effective Jira Reports and Dashboards

Now that you know the basics of creating custom reports, charts, and graphs in Jira, here are a few tips to make sure your dashboards are effective:
Keep it simple: Don’t overwhelm yourself or your team with too much data. Focus on the key metrics that drive decision-making.
Use multiple gadgets: Instead of relying on one big chart, combine several smaller gadgets (e.g., pie charts, bar charts, issue statistics) to create a comprehensive view.
Customize by role: Different roles need different data. Customize dashboards for individual team members (e.g., product owner, scrum master, developer) so everyone sees what’s most relevant to them.
Update regularly: Dashboards are most effective when they’re kept up to date. Make sure your filters and charts reflect the most recent data.
Conclusion
Creating custom reports, charts, and graphs in Jira doesn’t need to be a daunting task. With the right tools—like Jira Query Language (JQL), built-in reporting features, and helpful add-ons—you can turn your Jira data into actionable insights. Whether you’re looking to track progress, identify roadblocks, or share performance metrics, custom reports and dashboards can make all the difference.

If you're looking to enhance your Jira experience even further, consider integrating a Middleware Jira Sprint Reports plugin. This plugin provides seamless connections between Jira and other platforms, unlocking more advanced reporting, automation, and synchronization options tailored to your team's specific needs.
FAQs
How to generate reports from Jira?
Go to Reports in your project sidebar, select a report type (like Sprint Report or Velocity Chart), and Jira will generate it based on project data.
How to create tables in Jira?
You can create tables in Jira using the Table formatting feature in the editor or by using Jira Query Language (JQL) to display structured data in dashboards.
Can I create custom reports in Jira?
Yes, you can create custom reports using JQL, dashboards, and third-party add-ons like eazyBI or Custom Charts for Jira.
How to extract reports from Jira?
You can export reports by clicking "Export" in the report view, using JQL queries, or integrating Jira with BI tools like Power BI or Excel.